Open Access
Fig. B.1
Download original image
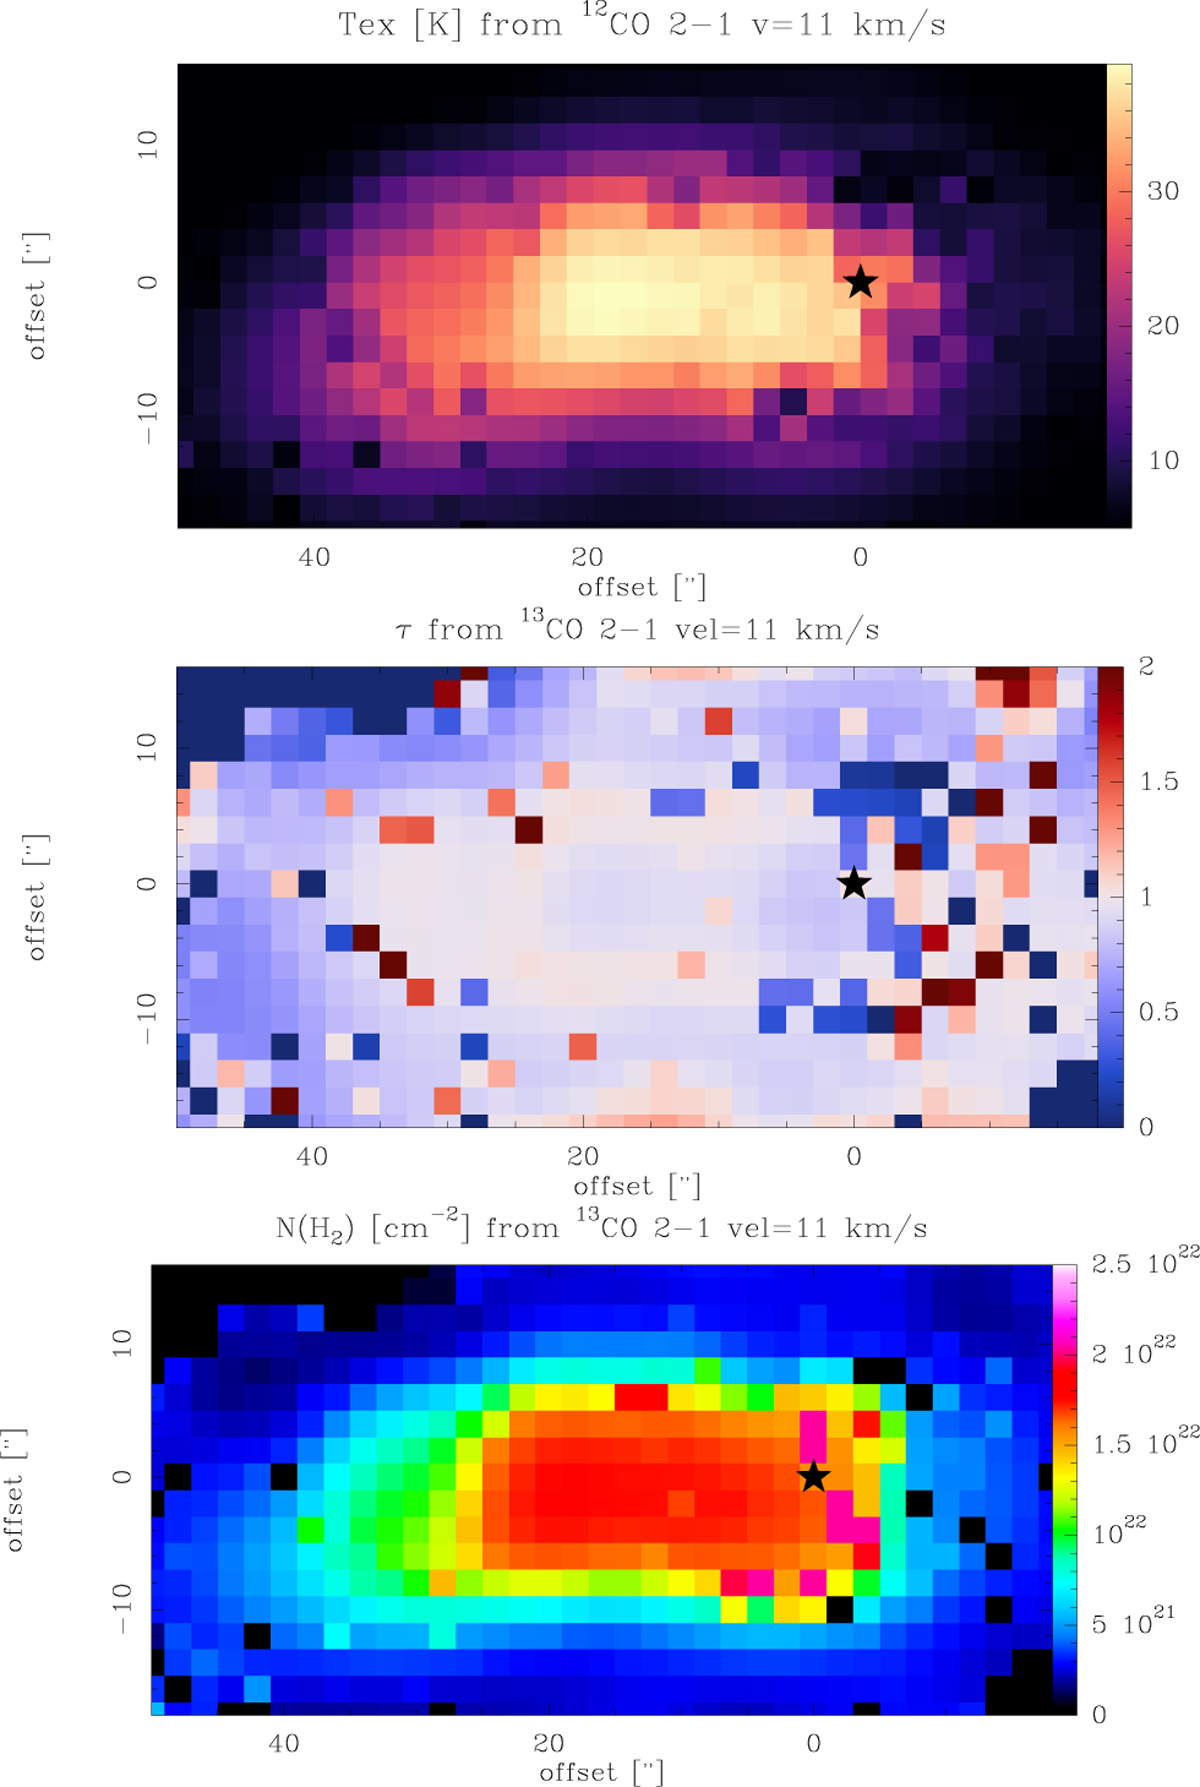
Maps of physical properties of proplyd #7. Top: Map of the excitation temperature derived from the 12CO 2→1 line. Middle: Map of the 13CO opacity. Bottom: Map of the H2 column density, calculated from the 13CO column density. See text for all calculations.
Current usage metrics show cumulative count of Article Views (full-text article views including HTML views, PDF and ePub downloads, according to the available data) and Abstracts Views on Vision4Press platform.
Data correspond to usage on the plateform after 2015. The current usage metrics is available 48-96 hours after online publication and is updated daily on week days.
Initial download of the metrics may take a while.