Fig. 2
Download original image
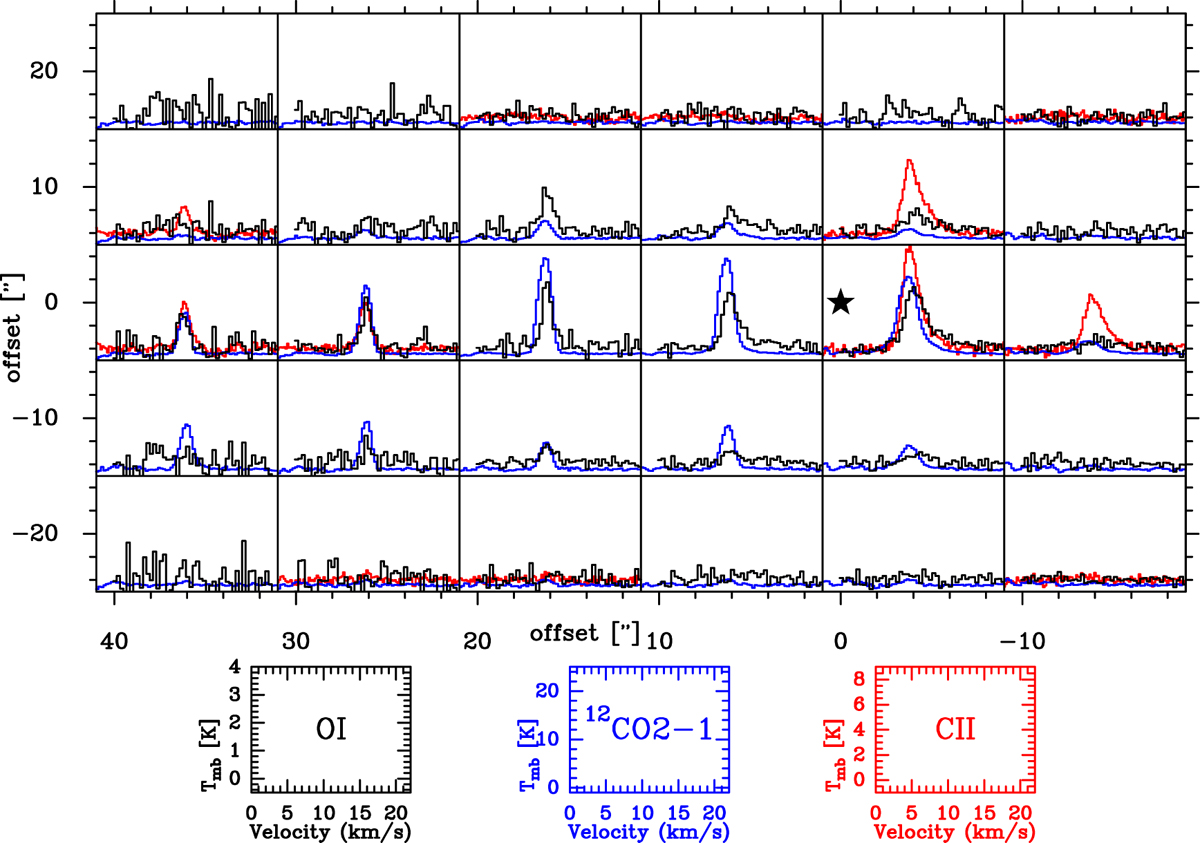
[O I] 63 μm, [C II] 158 μm, and 12CO 2→1 spectra of proplyd #7. To increase the S/N, the [O I] data were smoothed to an angular resolution of 10″ and re-gridded to 10″ (original resolution 6″ on a ~2″ sampling grid). The velocity resolution was degraded to ~0.4 km s−1. The [C II] (CO) spectra are on their nominal angular resolution of 14″ (12″) and velocity resolution of 0.2 (0.3) km s−1. The displayed main beam brightness temperature and velocity ranges are indicated in the small lower panels. The star indicates the approximate location of the YSO.
Current usage metrics show cumulative count of Article Views (full-text article views including HTML views, PDF and ePub downloads, according to the available data) and Abstracts Views on Vision4Press platform.
Data correspond to usage on the plateform after 2015. The current usage metrics is available 48-96 hours after online publication and is updated daily on week days.
Initial download of the metrics may take a while.