Fig. 5
Download original image
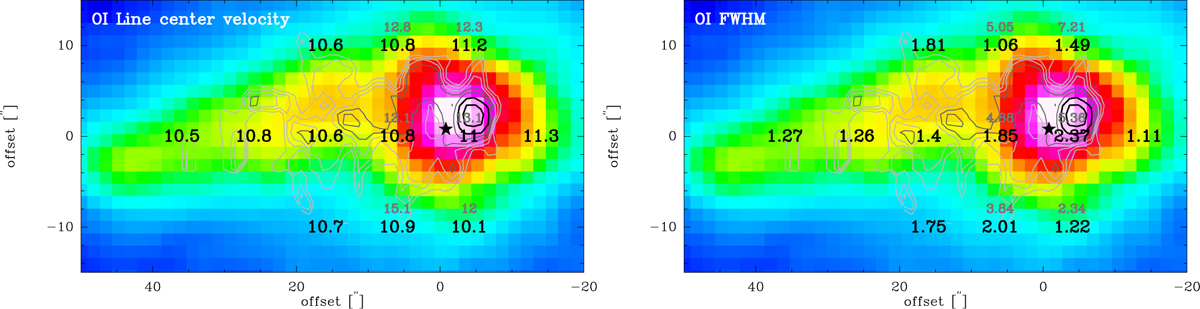
Distribution of [O I] line centre velocity and FWHM. Overlays of [O I] line integrated (v=9 to 15 km s−1) emission (contour levels 5, 6, 7, 8, and 8.5 K km s−1) on Herschel/PACS 70 μm emission in color. The left panel shows the line centre velocities in km s−1 of the two components (first component in black, second in grey) and the right panel the linewidth in km s−1. The values (Table 1) were determined from Gaussian fits to the spectra from Fig. 2.
Current usage metrics show cumulative count of Article Views (full-text article views including HTML views, PDF and ePub downloads, according to the available data) and Abstracts Views on Vision4Press platform.
Data correspond to usage on the plateform after 2015. The current usage metrics is available 48-96 hours after online publication and is updated daily on week days.
Initial download of the metrics may take a while.