Fig. 6
Download original image
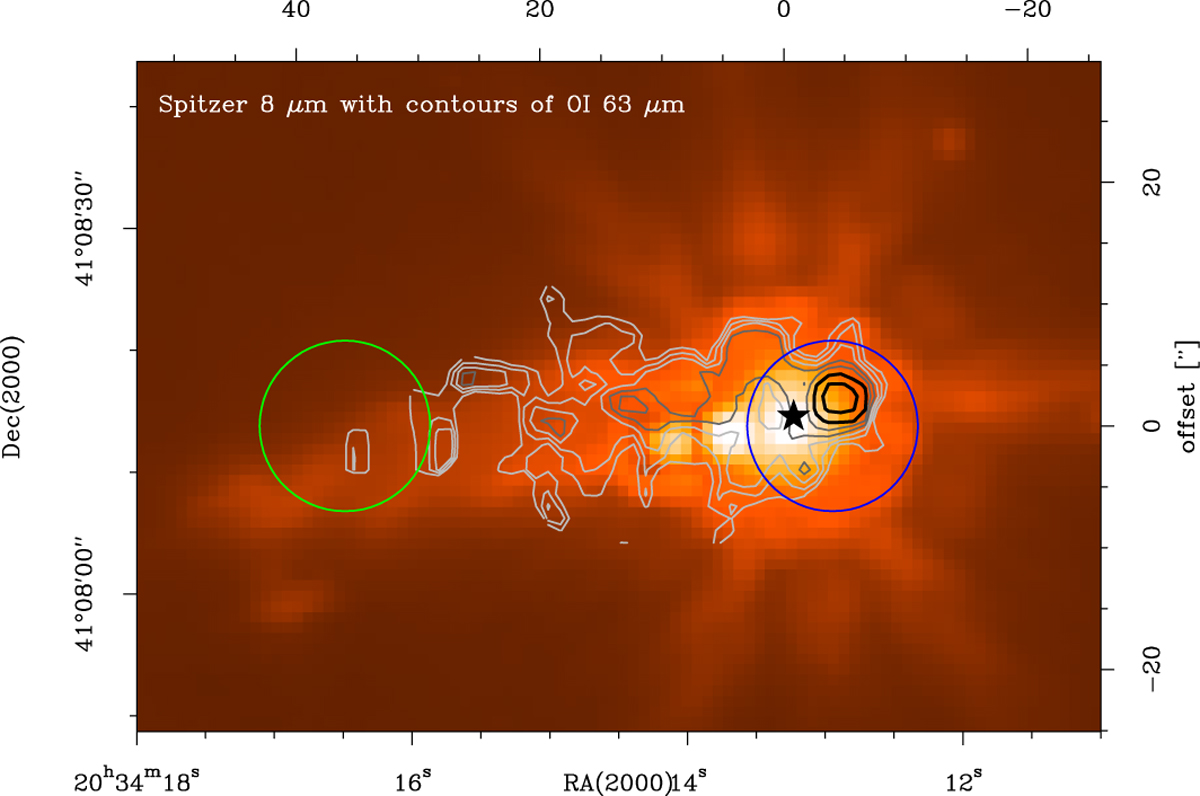
Spitzer 8 μm image of proplyd #7. The NIR map is in units of MJy/sr, ranging from 44 to 1.4 ± 104 with contours of [O I] emission (5, 6, 7, 8, 8.5 K km s−1) overlaid. Two positions where the PDR modelling was performed are indicated: position 1 (offset −4″,0) with a blue circle (radius 7″) and position 2 (offset 36″, 0) with a green circle, respectively.
Current usage metrics show cumulative count of Article Views (full-text article views including HTML views, PDF and ePub downloads, according to the available data) and Abstracts Views on Vision4Press platform.
Data correspond to usage on the plateform after 2015. The current usage metrics is available 48-96 hours after online publication and is updated daily on week days.
Initial download of the metrics may take a while.