Fig. 7
Download original image
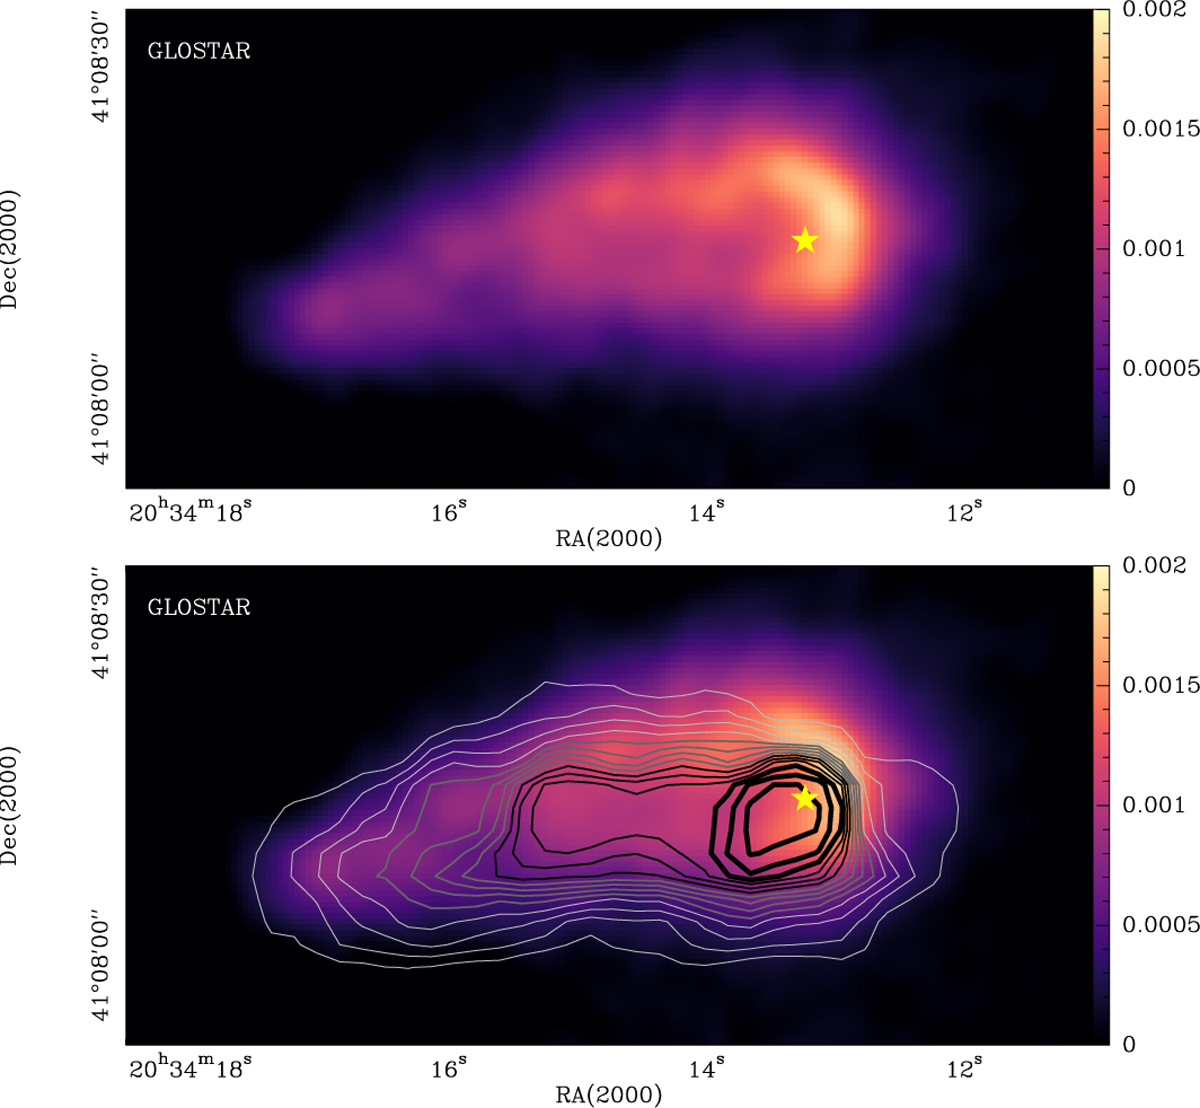
GLOSTAR 5.9 GHz images of proplyd #7. The top image shows the GLOSTAR data only. The image scale is in Jy/beam at an angular resolution of 4″. The star indicates the position of the YSO. The lower panel displays the same radio image with contours of 13CO 2→1 emission overlayed. The contour lines have values of 5–37.5 K km s−1 in steps of 2.5 K km s−1.
Current usage metrics show cumulative count of Article Views (full-text article views including HTML views, PDF and ePub downloads, according to the available data) and Abstracts Views on Vision4Press platform.
Data correspond to usage on the plateform after 2015. The current usage metrics is available 48-96 hours after online publication and is updated daily on week days.
Initial download of the metrics may take a while.