Fig. 9
Download original image
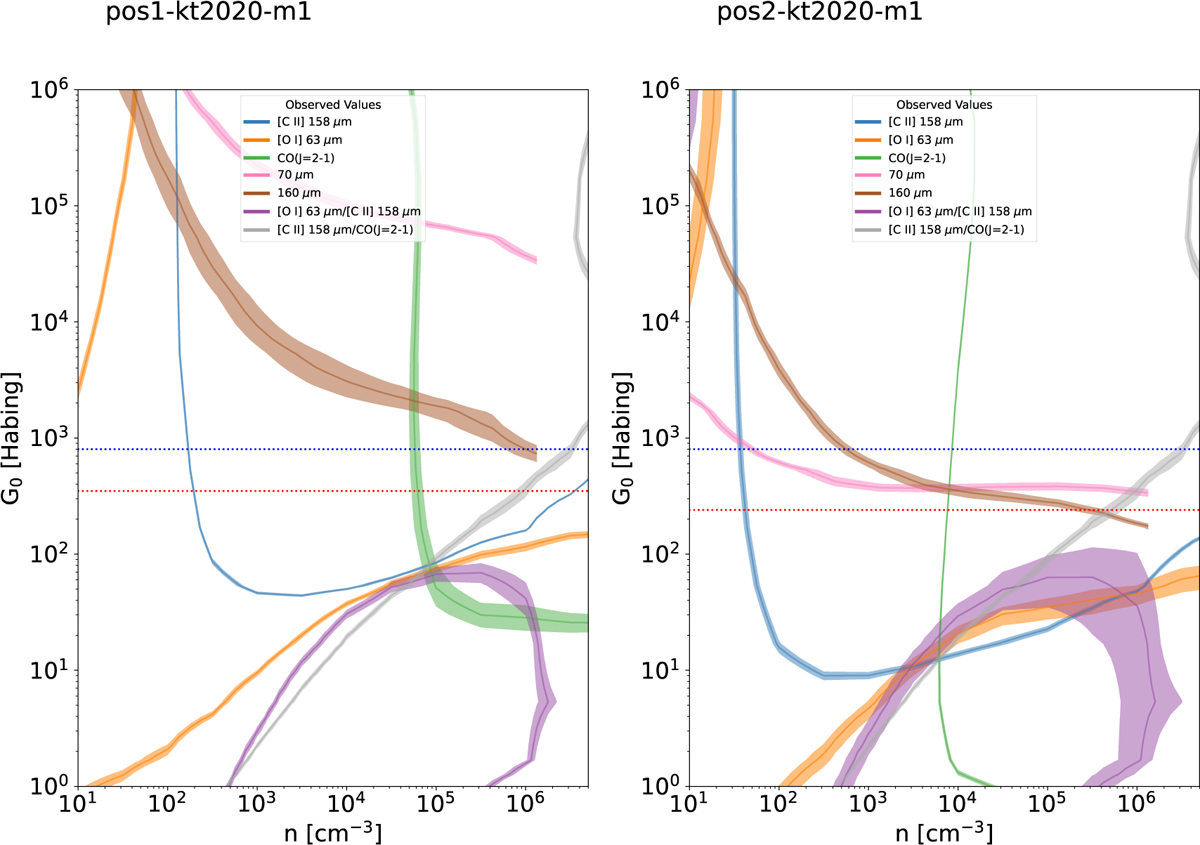
PDR KOSMA-τ model results. The left (right) panel shows the diagnostic diagrams for UV-field and density, derived from the observed lines, line ratios, and FIR fluxes for positions 1 and 2 in proplyd #7. The red and blue dashed lines indicate the UV field determined from the FIR Herschel fluxes and from the stellar census, respectively, for positions 1 and 2.
Current usage metrics show cumulative count of Article Views (full-text article views including HTML views, PDF and ePub downloads, according to the available data) and Abstracts Views on Vision4Press platform.
Data correspond to usage on the plateform after 2015. The current usage metrics is available 48-96 hours after online publication and is updated daily on week days.
Initial download of the metrics may take a while.