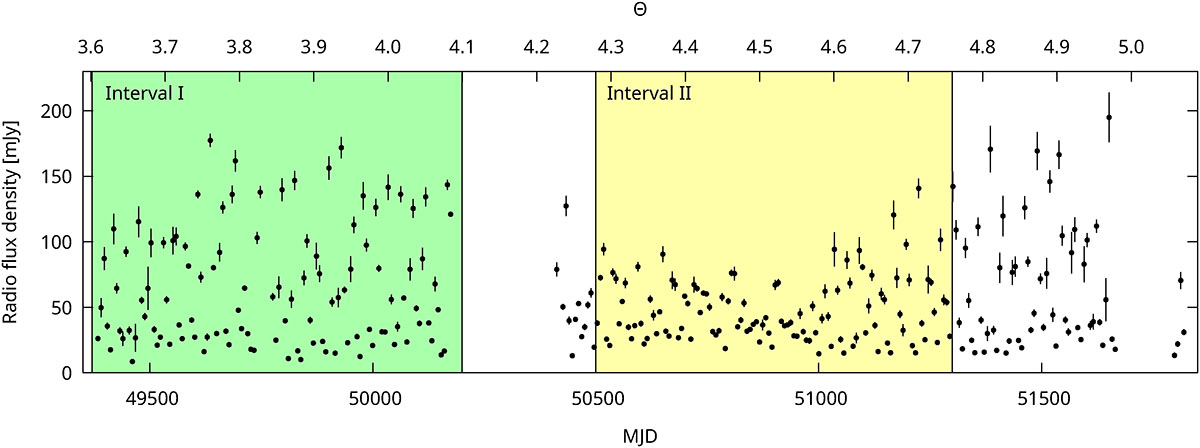
Fig. 1.
Download original image
Radio light curve resulting from long-term monitoring of LS I +61 303 by the GBI at 8 GHz. The lower time axis is expressed in terms of MJD and the upper one in cycles of the long-term modulation, using Plong = 1667 d and T0 = MJD 43366.275. These data have been averaged in time bins of width seven days. Two intervals are highlighted (green and yellow), which are analyzed individually, as explained in the text.
Current usage metrics show cumulative count of Article Views (full-text article views including HTML views, PDF and ePub downloads, according to the available data) and Abstracts Views on Vision4Press platform.
Data correspond to usage on the plateform after 2015. The current usage metrics is available 48-96 hours after online publication and is updated daily on week days.
Initial download of the metrics may take a while.