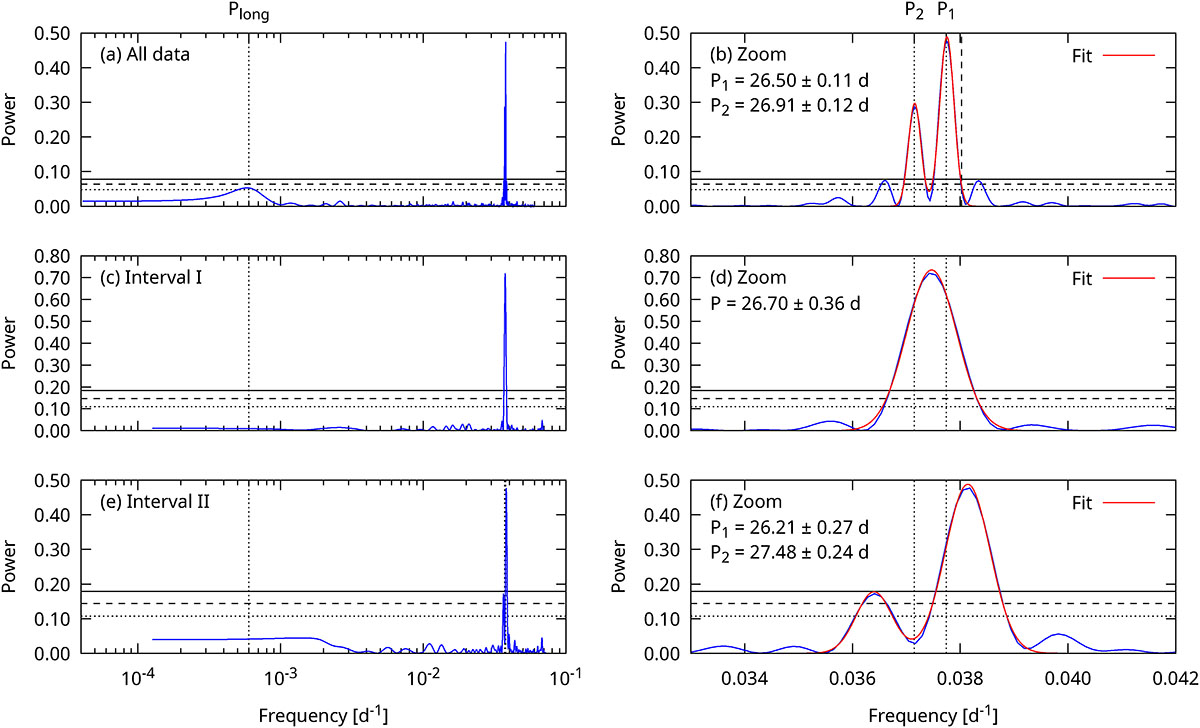
Fig. 3.
Download original image
GLS periodograms of the GBI 8 GHz data. The horizontal lines indicate FAP levels of 10% (dotted), 1% (dashed), and 0.1% (solid). (a) Periodogram of the full light curve shown in Fig. 1. A peak at Plong is present along with a feature at P1. (b) Zoom onto the region around the orbital period. A distinct two-peaked profile is present. The vertical dashed lines marks the position of the possible third period, P3. The result of fitting the periodogram with Gaussian functions is shown as the red solid curve. We report the uncertainties of the resulting periods using the 1σ standard deviations of these Gaussians. (c) Periodogram of interval I (green area in Fig. 1). The peak at Plong is absent. (d) The zoom onto the orbital region reveals the presence of only one peak, at Paverage. (e) Periodogram of interval II (yellow area in Fig. 1). (f) Zoom onto the orbital region. There is a two-peaked profile, with the periods being largely compatible with the literature values of P1 and P2.
Current usage metrics show cumulative count of Article Views (full-text article views including HTML views, PDF and ePub downloads, according to the available data) and Abstracts Views on Vision4Press platform.
Data correspond to usage on the plateform after 2015. The current usage metrics is available 48-96 hours after online publication and is updated daily on week days.
Initial download of the metrics may take a while.