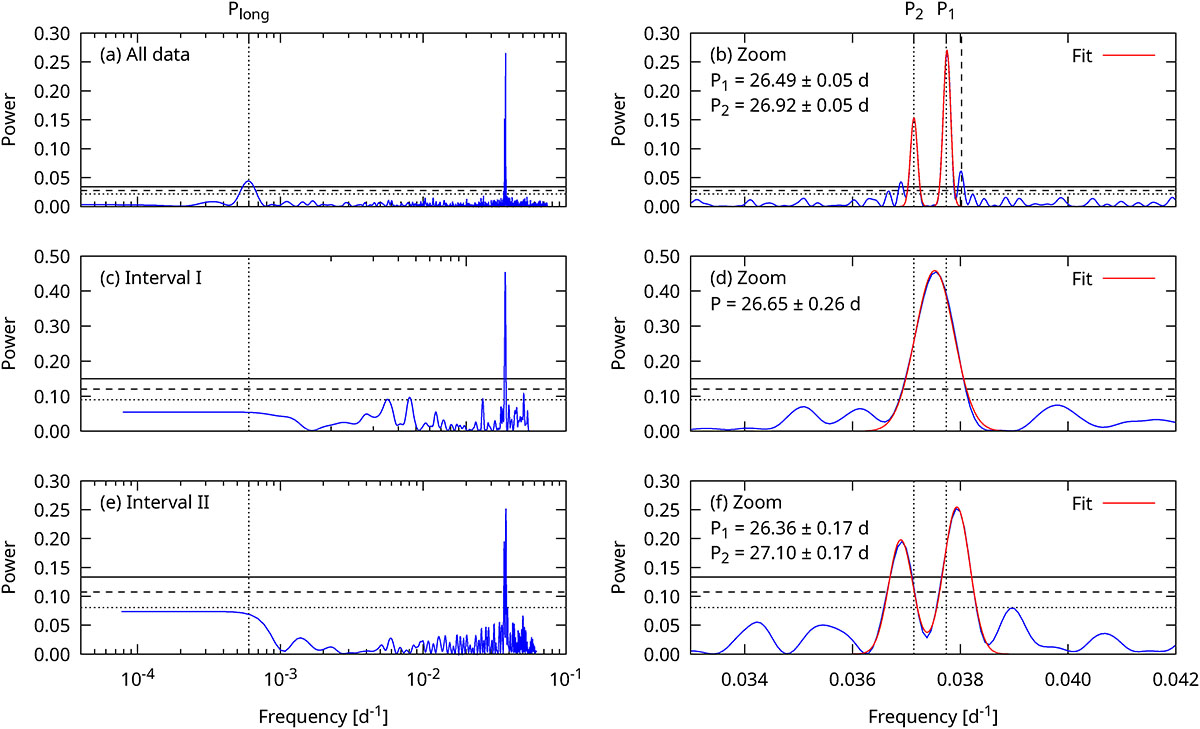
Fig. 4.
Download original image
GLS periodograms of the OVRO 15 GHz data. (a) Periodogram of the entire light curve shown in Fig. 2 (cf. Jaron et al. 2024). (b) Zoom onto the region around the orbital period. A distinct two-peaked profile is present. The vertical dashed line marks the position of P3, as reported by Zhang (2024). A significant feature is indeed detected at this position. (c) Periodogram of interval I (green-shaded area in Fig. 2). The only significant feature is at approximately the orbital period. (d) Zoom. There is only one peak. (e) Periodogram of interval II (yellow-shaded area in Fig. 2). The only significant feature is at approximately the orbital period. (f) Zooming in on the orbital range reveals a two-peaked profile.
Current usage metrics show cumulative count of Article Views (full-text article views including HTML views, PDF and ePub downloads, according to the available data) and Abstracts Views on Vision4Press platform.
Data correspond to usage on the plateform after 2015. The current usage metrics is available 48-96 hours after online publication and is updated daily on week days.
Initial download of the metrics may take a while.