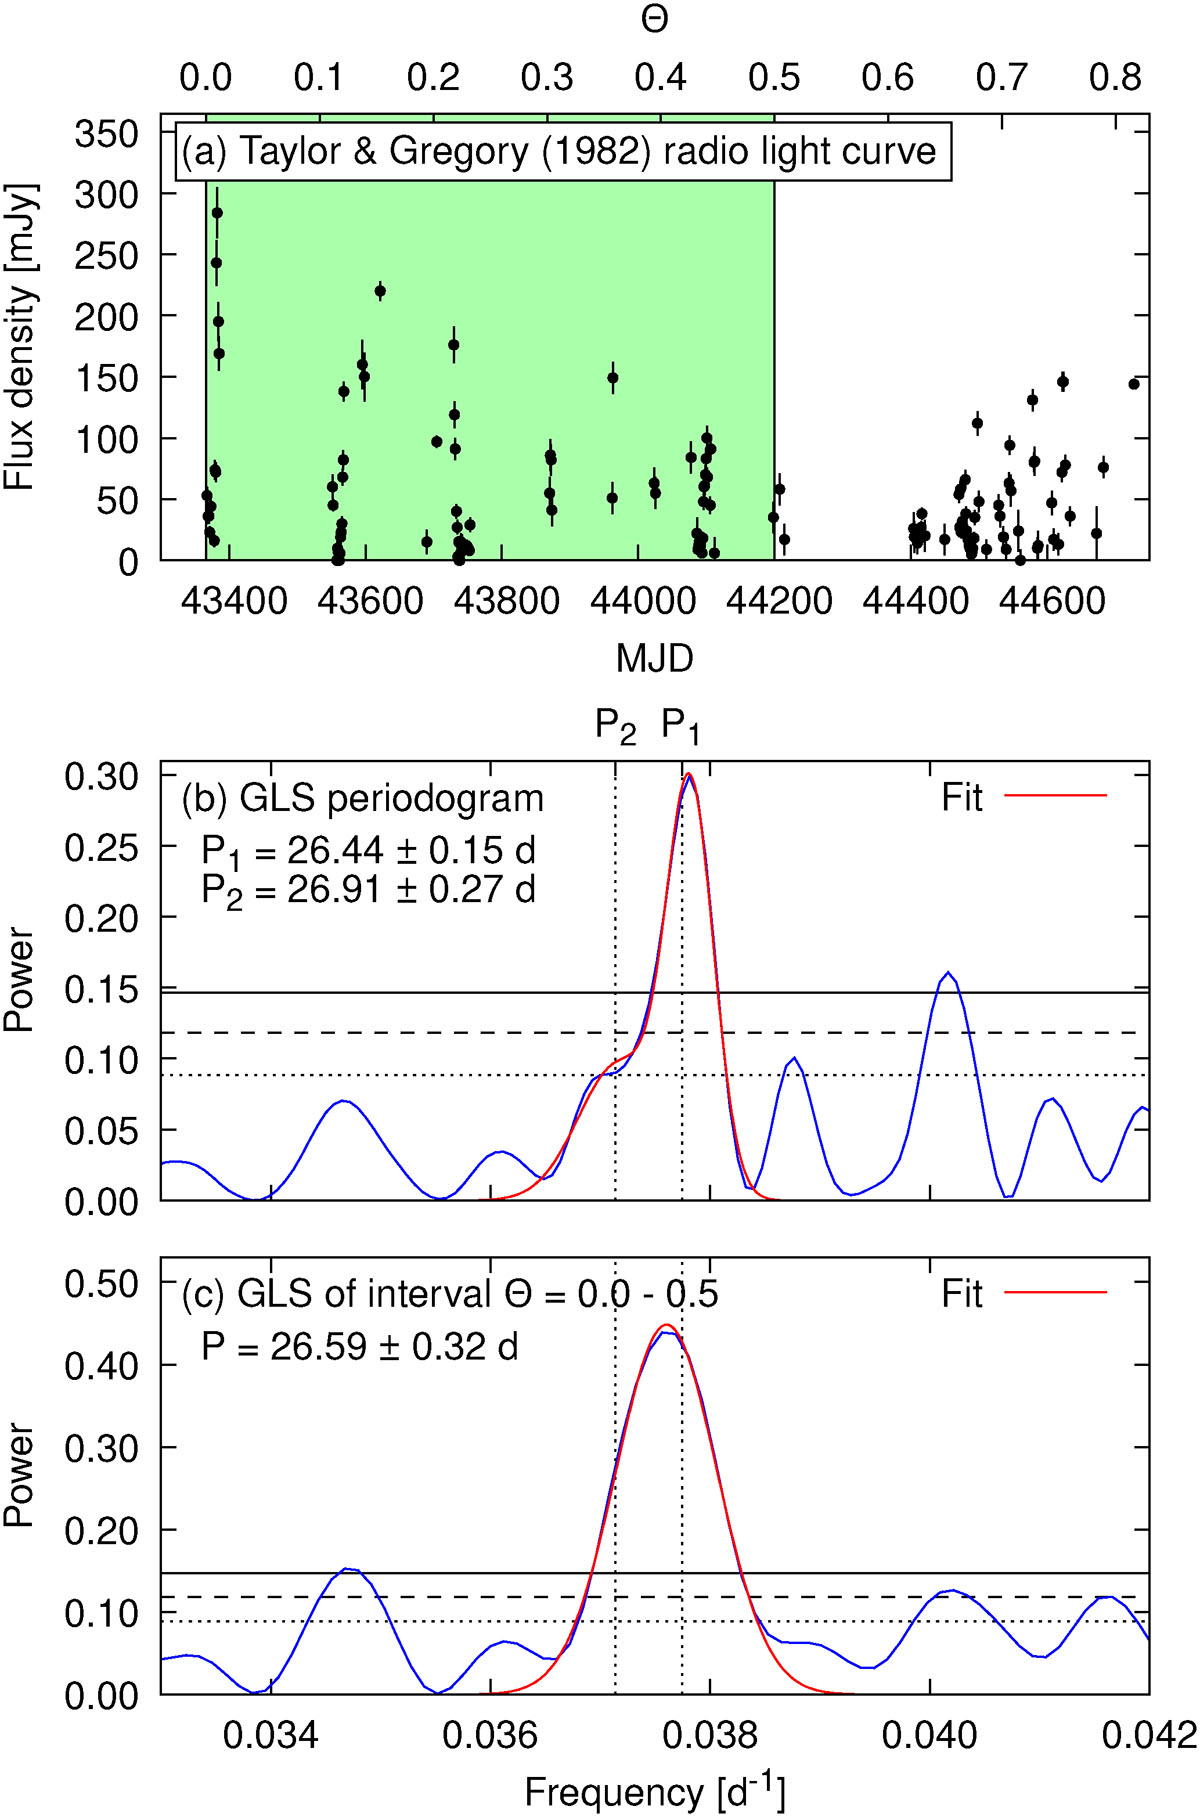
Fig. 5.
Download original image
Radio observations of LS I +61 303 taken from Taylor & Gregory (1982). (a) Light curve at 5 and 10.5 GHz. An interval for separate analysis is shaded in green. (b) Periodogram of the full light curve. The most powerful peak is consistent with the orbital period. The fit to the periodogram, however, requires the superposition of two Gaussians. (c) Periodogram of super-orbital interval Θ = 0.0 − 0.5 (green-shaded area in panel a). The one-peaked profile is shifted toward the middle of the positions of P1 and P2 and is fitted by a single Gaussian.
Current usage metrics show cumulative count of Article Views (full-text article views including HTML views, PDF and ePub downloads, according to the available data) and Abstracts Views on Vision4Press platform.
Data correspond to usage on the plateform after 2015. The current usage metrics is available 48-96 hours after online publication and is updated daily on week days.
Initial download of the metrics may take a while.