Open Access
Fig. 6.
Download original image
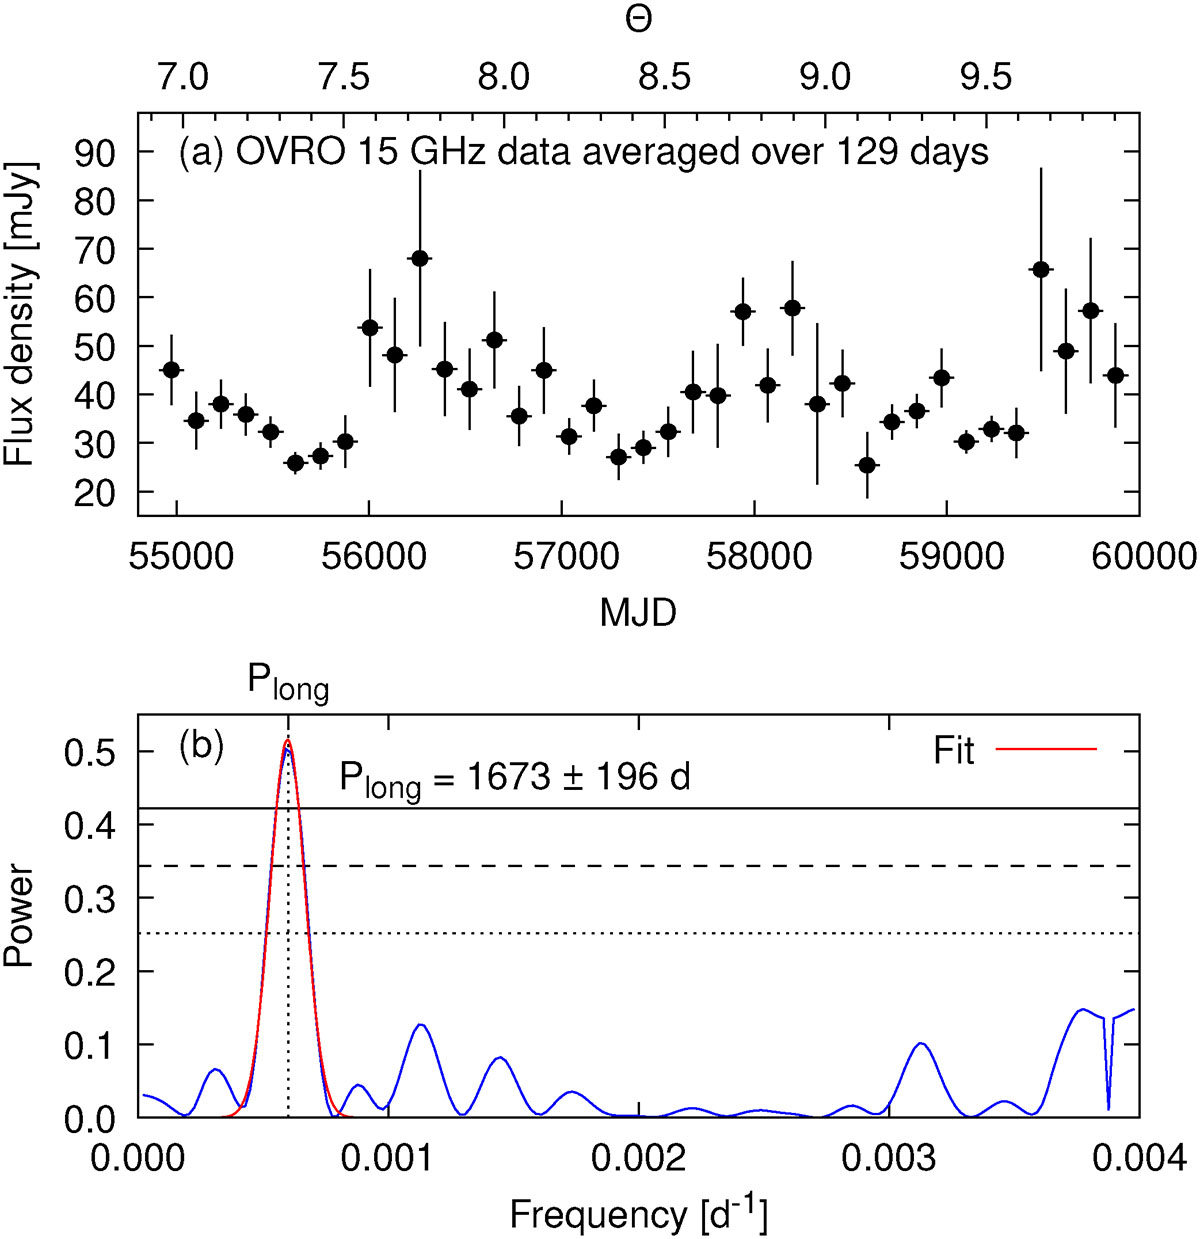
(a) OVRO 15 GHz data (see Fig. 2) averaged in time-bins of width 129 d. (b) GLS periodogram of the averaged data. There is only one significant peak, at a period of 1673 ± 196 d, in full agreement with the long-term period of the source.
Current usage metrics show cumulative count of Article Views (full-text article views including HTML views, PDF and ePub downloads, according to the available data) and Abstracts Views on Vision4Press platform.
Data correspond to usage on the plateform after 2015. The current usage metrics is available 48-96 hours after online publication and is updated daily on week days.
Initial download of the metrics may take a while.