Fig. 8.
Download original image
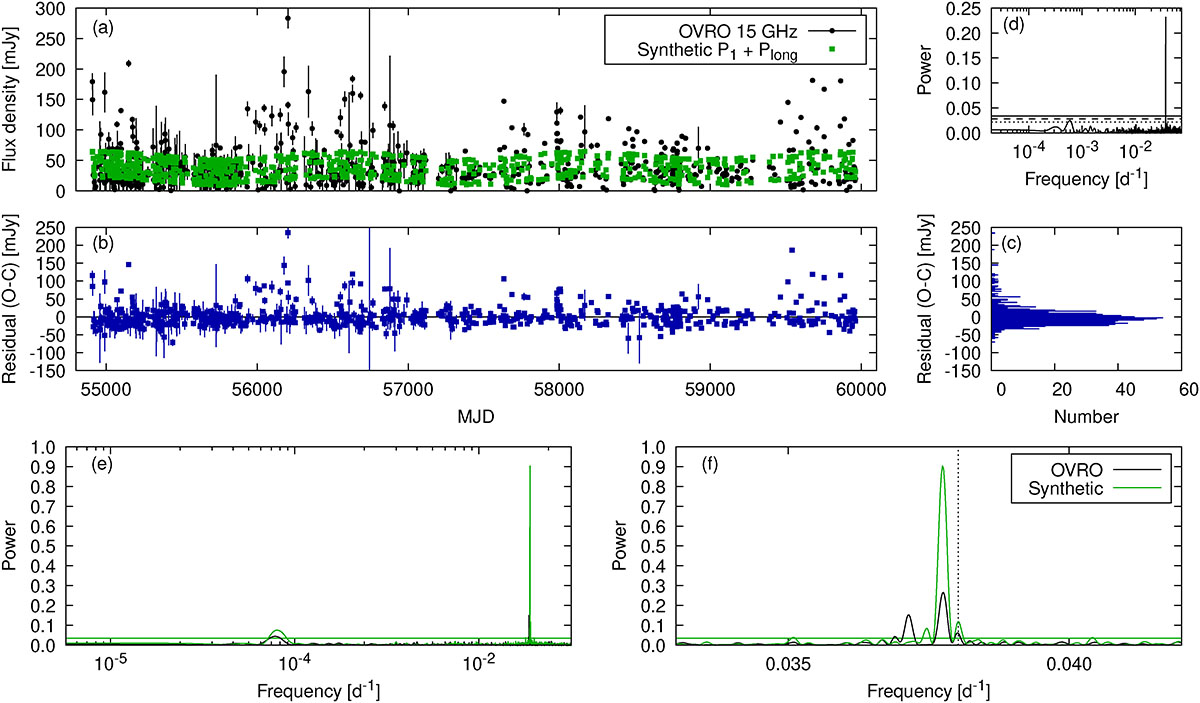
Synthetic data and their analysis. (a) Synthetic data contain the periods P1 and Plong. (b) Residuals (observed minus computed). (c) Histogram of the residuals. (d) GLS periodogram of the residuals, showing a significant peak at P2. (e) Full GLS periodogram, the peak at Plong is present for both the observational and the synthetic data. (f) Zoom onto the orbital frequency range. The peak at P1 is reproduced by the synthetic data, but besides that, the periodograms differ substantially between observational and synthetic data.
Current usage metrics show cumulative count of Article Views (full-text article views including HTML views, PDF and ePub downloads, according to the available data) and Abstracts Views on Vision4Press platform.
Data correspond to usage on the plateform after 2015. The current usage metrics is available 48-96 hours after online publication and is updated daily on week days.
Initial download of the metrics may take a while.