Fig. 5
Download original image
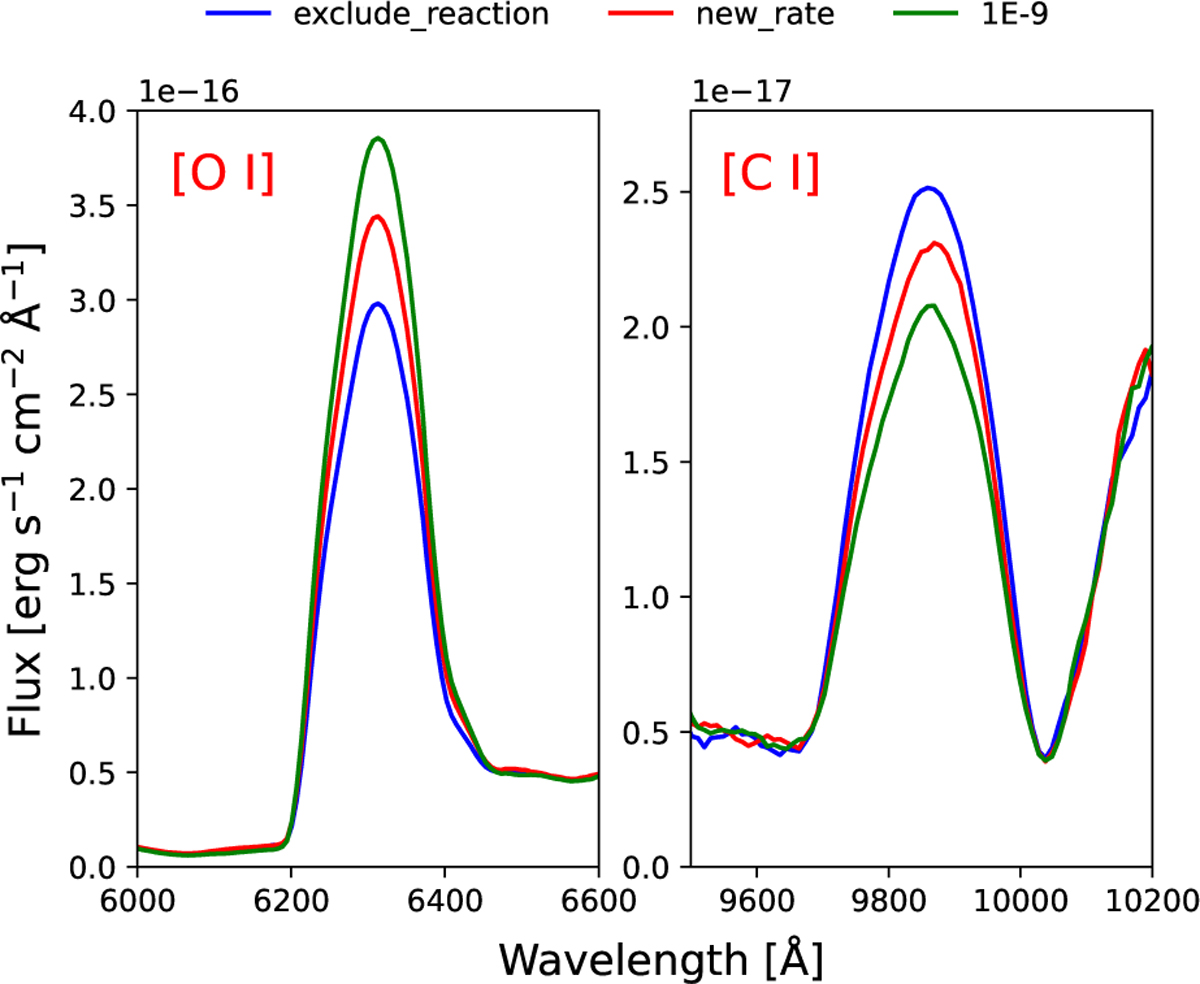
Left panel: comparison of the [O I] λλ6300, 6364 line strength for three different rates for C + O+ → C+ + O (1D). The simulated model is the he4p0 model from Barmentloo & Jerkstrand (2025), evaluated at 300 days after explosion. Line strengths decrease by about 10% compared to the model with the rate used in Jerkstrand et al. (2011). Right panel: same models as in the left panel, but now comparing the strengths of [C I] λλ9824, 9850. Note that the high Doppler blending makes the doublets appear as single, broad features.
Current usage metrics show cumulative count of Article Views (full-text article views including HTML views, PDF and ePub downloads, according to the available data) and Abstracts Views on Vision4Press platform.
Data correspond to usage on the plateform after 2015. The current usage metrics is available 48-96 hours after online publication and is updated daily on week days.
Initial download of the metrics may take a while.