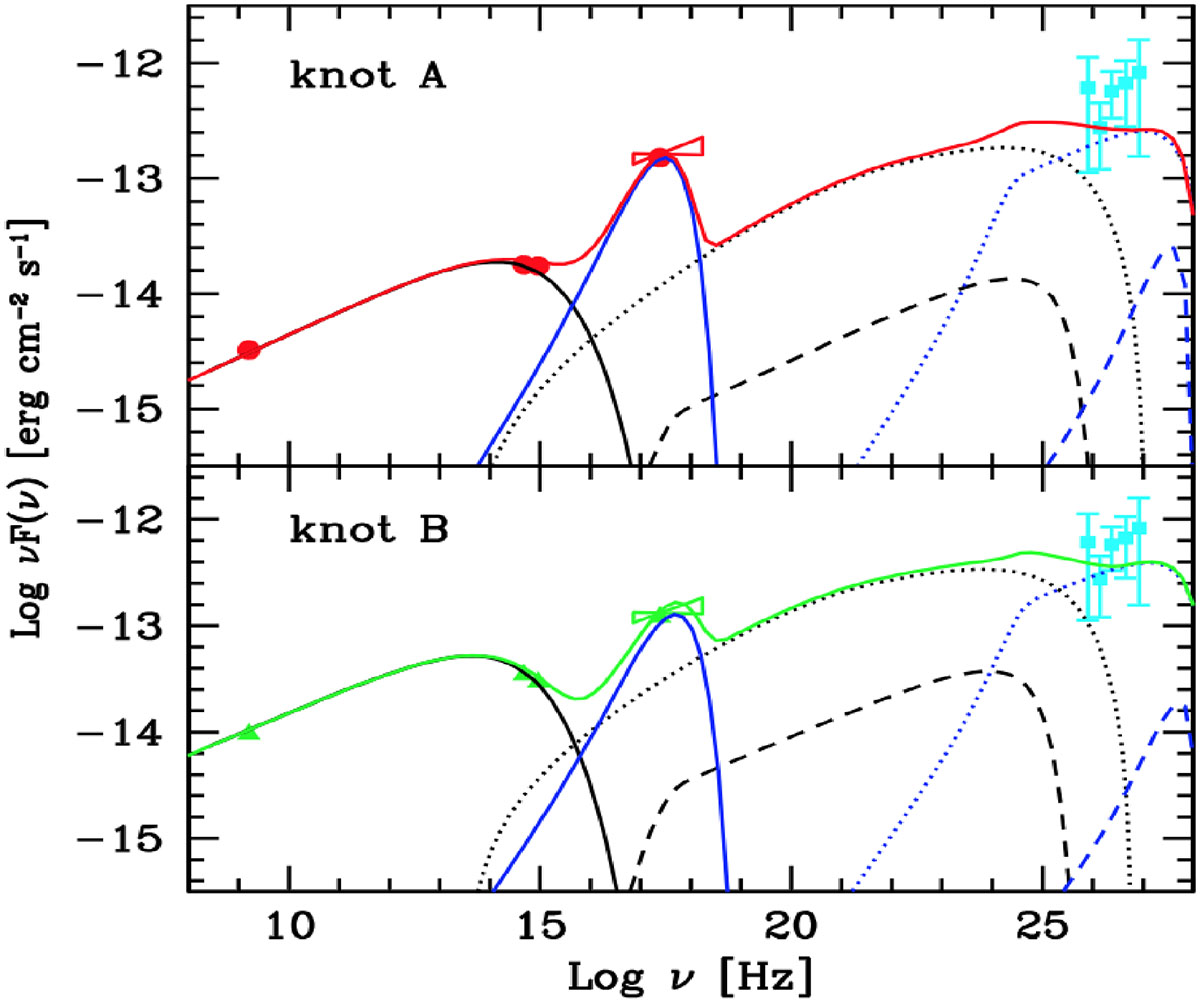
Fig. 1.
Download original image
SED (circles) of knots A (upper panel) and B (lower panel) of the jet of 3C273 (from Sambruna et al. 2001; we also report the X-ray spectral slopes derived in He et al. 2023). Light blue data points report the (EBL-deabsorbed) VERITAS spectrum. The lines show the result of the model for the electrons accelerated at the shock (black) and at the shear (blue); solid lines for synchrotron, dotted lines for IC from synchrotron, and dashed lines for the IC CMB model. The red and green lines report the total emission.
Current usage metrics show cumulative count of Article Views (full-text article views including HTML views, PDF and ePub downloads, according to the available data) and Abstracts Views on Vision4Press platform.
Data correspond to usage on the plateform after 2015. The current usage metrics is available 48-96 hours after online publication and is updated daily on week days.
Initial download of the metrics may take a while.