Open Access
Fig. 2.
Download original image
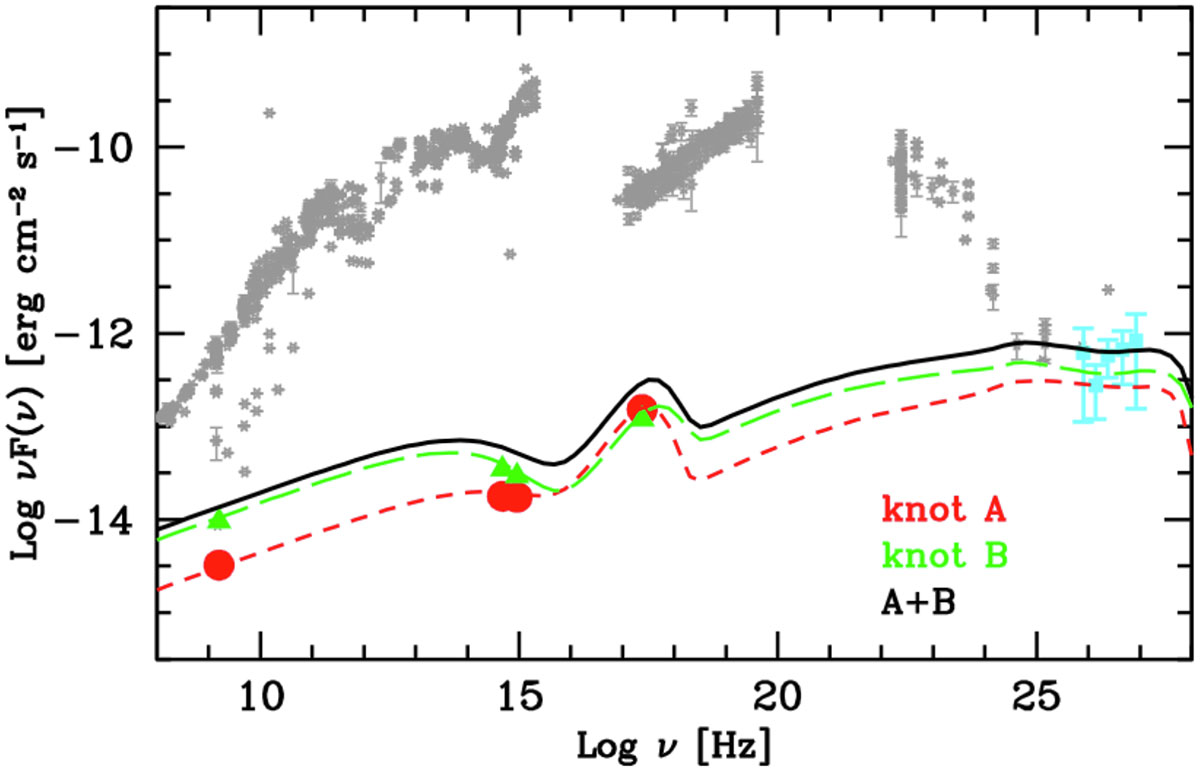
Historical SED data for the 3C273 core (gray) with the VERITAS spectrum (light blue) and the SED of knots A and B. Red, green, and black lines show the emission from knot A, knot B, and the total, respectively.
Current usage metrics show cumulative count of Article Views (full-text article views including HTML views, PDF and ePub downloads, according to the available data) and Abstracts Views on Vision4Press platform.
Data correspond to usage on the plateform after 2015. The current usage metrics is available 48-96 hours after online publication and is updated daily on week days.
Initial download of the metrics may take a while.