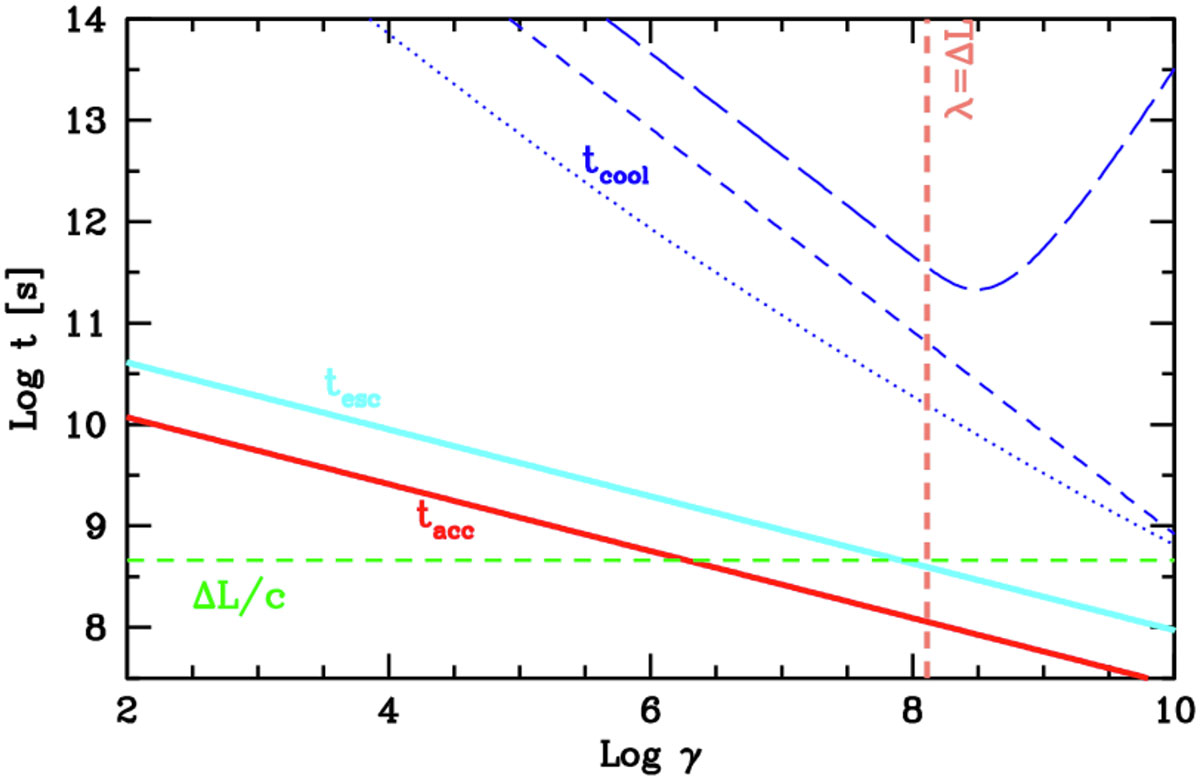
Fig. 3.
Download original image
Timescales (in the source frame) relevant for the shear acceleration process as a function of the particle Lorentz factor for knot A. Solid lines show the acceleration (red) and escape (light blue) timescales. The darker blue curves show the cooling times for the synchrotron (dashed), IC on the synchrotron photons (dotted), and the IC CMB model (long-dashed). The vertical dashed orange line shows the Lorentz factor above which the mean free path exceeds the width of the shear layer, halting the acceleration process. The horizontal dashed green line indicates the light-crossing time of the shear layer.
Current usage metrics show cumulative count of Article Views (full-text article views including HTML views, PDF and ePub downloads, according to the available data) and Abstracts Views on Vision4Press platform.
Data correspond to usage on the plateform after 2015. The current usage metrics is available 48-96 hours after online publication and is updated daily on week days.
Initial download of the metrics may take a while.