Fig. 1
Download original image
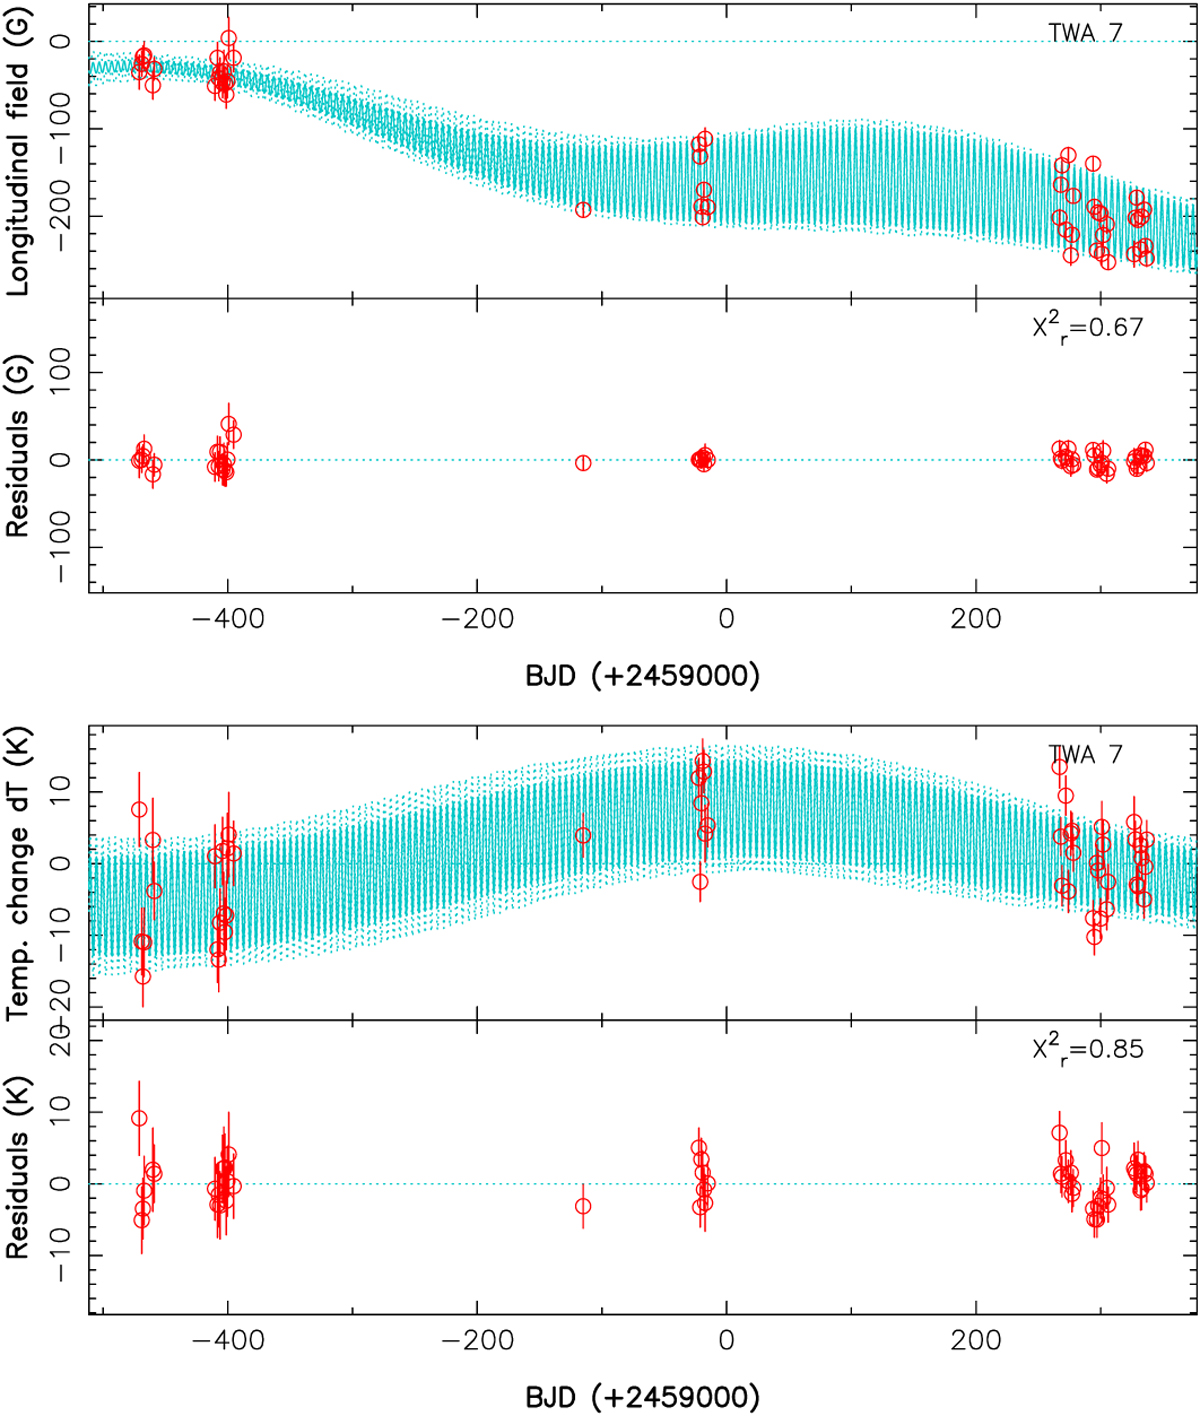
Longitudinal magnetic field Bℓ (top panel) and temperature variations d T (bottom panel) of TWA 7 (red dots) and the QP GPR fit to the data (cyan full line) with the corresponding 68% confidence intervals (cyan dotted lines). The residuals, shown in the bottom plot of each panel, yielded rms of 8.2 G and 2.9 K (![]() and 0.85). March 01 of 2019, 2020, and 2021 at noon correspond to x-values of −456,−90, and 275, respectively. A zoom in on the 2021 data is shown in Fig. B.1.
and 0.85). March 01 of 2019, 2020, and 2021 at noon correspond to x-values of −456,−90, and 275, respectively. A zoom in on the 2021 data is shown in Fig. B.1.
Current usage metrics show cumulative count of Article Views (full-text article views including HTML views, PDF and ePub downloads, according to the available data) and Abstracts Views on Vision4Press platform.
Data correspond to usage on the plateform after 2015. The current usage metrics is available 48-96 hours after online publication and is updated daily on week days.
Initial download of the metrics may take a while.