| Issue |
A&A
Volume 704, December 2025
|
|
|---|---|---|
| Article Number | A307 | |
| Number of page(s) | 16 | |
| Section | Stellar atmospheres | |
| DOI | https://doi.org/10.1051/0004-6361/202557322 | |
| Published online | 24 December 2025 | |
Searching for close-in planets around TWA 7 with SPIRou
1
Univ. de Toulouse, CNRS, IRAP,
14 avenue Belin,
31400
Toulouse,
France
2
Leiden Observatory, Leiden University,
Niels Bohrweg 2, 2333
CA Leiden,
The Netherlands
3
Univ. Grenoble Alpes, CNRS,
IPAG,
38000
Grenoble,
France
4
Departamento de Física – ICEx – UFMG,
Av. Antônio Carlos, 6627,
30270-901
Belo Horizonte, MG,
Brazil
★ Corresponding author: This email address is being protected from spambots. You need JavaScript enabled to view it.
Received:
19
September
2025
Accepted:
19
November
2025
Abstract
We outline in this paper observations of the young pre-main-sequence low-mass star TWA 7 hosting a debris disk and a distant planet. Using data collected with the near-infrared SPIRou spectropolarimeter and precision velocimeter at the Canada-France-Hawaii Telescope from early 2019 to mid 2021, we detected the magnetic field of TWA 7 from the circularly polarized Zeeman signatures and Zeeman broadening of atomic spectral lines and the rotational modulation of its longitudinal component at the known stellar rotation period (of 5.012 ± 0.007 d). We then modeled the large-scale and small-scale magnetic properties of TWA 7 using Zeeman-Doppler imaging. We find that TWA 7 hosted a mainly poloidal field that significantly evolved from 2019 to 2021 and that the dipole component became stronger (increasing from 0.5 kG in 2019 to 0.7 kG in 2021) and less inclined to the stellar rotation axis (from 22° in 2019 to 15° in 2021). We also analyzed the radial velocities of TWA 7 derived from the SPIRou data and found a tentative planet signature at a period of 15.2 d (with aliases at 20.8 and 30.4 d), which is very close to the detection limit of our data and would correspond to a 0.17 M♃ planet at a distance of 0.09 au if confirmed. Finally, we report that the 1083 nm He I and 1282 nm Paβ lines of TWA 7 are modulated with a period of 6.6 d, different from the rotation period. This potentially hints at the presence of a close-in planet triggering star-planet interactions.
Key words: techniques: polarimetric / stars: low-mass / stars: magnetic field / planetary systems / stars: individual: TWA7 / stars: pre-main sequence
© The Authors 2025
 Open Access article, published by EDP Sciences, under the terms of the Creative Commons Attribution License (https://creativecommons.org/licenses/by/4.0), which permits unrestricted use, distribution, and reproduction in any medium, provided the original work is properly cited.
This article is published in open access under the Subscribe to Open model. This email address is being protected from spambots. You need JavaScript enabled to view it. to support open access publication.
1 Introduction
Over the past few decades, tremendous observational and theoretical efforts have been invested in the study of planetary systems of low-mass stars and how they form and evolve over their lifetime (e.g., Drążkowska et al. 2023). During the initial pre-main-sequence (PMS) stage, both the central host star and its future planets form more or less at the same time from a giant molecular cloud that collapses under the combined effect of gravity, turbulence and magnetic fields (André et al. 2014; Lebreuilly et al. 2024). This early phase of planet formation is still relatively unconstrained on the observational side, and it reflects the extremely challenging task of detecting young planets around PMS stars that exhibit a huge level of photometric and spectroscopic variability caused by multiple phenomena occurring at the heart of the accretion disk, including stochastic accretion, eruptive events, and rotational modulation (Cody et al. 2014; Sousa et al. 2016). Magnetic fields play a key role throughout this formation process (Suin et al. 2025), including in the core regions of the accretion disk, where the host star generates a magnetospheric gap, with the field funneling the disk material inward to the stellar surface and outward through outflows, while also controlling the stellar angular momentum until most of the disk gas and dust are exhausted (Zanni & Ferreira 2013; Bouvier et al. 2014; Romanova et al. 2021). Magnetic fields can also potentially stop inward migrating planets at the outer edge of the magnetospheric cavity (Lin et al. 1996; Romanova et al. 2019), thereby creating pileups of close-in bodies (Romanova & Lovelace 2006; Mulders et al. 2015) and saving them from falling into their host stars.
As a result of the extreme variability of these young stars, the most successful techniques at detecting extra-solar planets, namely the transit method based on continuous photometry (yielding estimates of planetary radii) and the radial velocity (RV) technique collecting data from ultra-stable spectrographs (yielding planetary masses), struggle to achieve reliable detections for a large sample of targets younger than 20 Myr. The few confirmed detections so far were obtained on the least active low-mass PMS stars, among which are AU Mic (Martioli et al. 2021; Donati et al. 2025b, aged ≃20 Myr) and V1298 Tau (David et al. 2019; Finociety et al. 2023b, aged ≃10 Myr), with their close-in multi-planet systems, and IRAS 04125+2902, which is the youngest of all (Barber et al. 2024, aged ≃3 Myr) and features at least one close-in planet. While some of these planets seem to be born with a bulk density comparable to that of the icy giants of the Solar System, others, particularly those closest to their host stars, have much lower densities, indicating puffedup radii or a different formation process (Finociety et al. 2023a; Barat et al. 2024; Donati et al. 2025a,c). More observations are obviously needed to obtain a statistically significant sample of close-in planets younger than 20 Myr.
Among the known young planets, a few of the most massive were detected with direct imaging at distances of tens of au from their host stars, for instance the two planets around PDS 70 (Haffert et al. 2019) and the planet recently found in the debris disk of TWA 7 (Lagrange et al. 2025), a 10 Myr star located in the young TW Hydra association (TWA). Searching for close-in planets around these stars can bring key constraints on planet formation models by providing additional information on the architectures of young planetary systems, rather than on only one side of the planet distribution with orbital distance. No close-in planet was detected around PDS 70 from velocimetric observations, with an upper limit on the mass of such planets of ≃4 M♃ at a distance of ≃0.2 au (corresponding to a period of ≃30 d; Donati et al. 2024).
In the present study, we analyze spectropolarimetric and velocimetric data of TWA 7 collected with the SPIRou near-infrared (nIR) spectropolarimeter (Donati et al. 2020) at the 3.6-m Canada-France-Hawaii Telescope (CFHT) over three consecutive seasons (2019, 2020 and 2021). After recalling the main parameters of TWA 7 in Sect. 2, we detail the recorded observations in Sect. 3, investigate the rotational modulation of magnetic and temperature proxies in Sect. 4, study the large-scale and small-scale magnetic topologies at the surface of TWA 7 with Zeeman-Doppler imaging (ZDI) in Sect. 5, and outline the RV and activity measurements with their modeling in Secs. 6 and 7. Finally, we summarize and discuss the implication of our results for our understanding of star and planet formation in Sect. 8.
2 The young M dwarf TWA 7
The PMS M2 dwarf TWA 7 (CE Ant) is located at 34.01 ± 0.03 pc (Gaia Collaboration 2020) in TWA and aged 10 ± 2 Myr (Luhman 2023). Classified as a weak-line, non-accreting T-Tauri star, TWA 7 has a photospheric temperature of Teff= 3509 ± 116 K, a radius of R★=0.92 ± 0.12 R⊙, and a mass of M★=0.46 ± 0.09 M⊙, yielding a surface gravity log g=4.18 ± 0.18 dex (with g in cm s−2) and a luminosity of L★=0.115 ± 0.019 L⊙ (Stassun et al. 2018). In this reference paper, data from different surveys were assembled and matched with PHOENIX stellar evolution models (Husser et al. 2013) to derive reliable stellar parameters in a homogeneous way for a vast ensemble of stars. Consistent stellar parameters were derived from our SPIRou nIR spectra (see Sect. 3). Matching the quoted temperature and radius with other evolution models yields slightly different masses, 0.40 ± 0.08 M⊙ for models of Baraffe et al. (2015) and non-magnetic models of Feiden (2016), and 0.54 ± 0.12 M⊙ for magnetic models of Feiden (2016), both in agreement within error bars with the previous estimate. In this picture, TWA 7 is fully convective and still contracting toward the mainsequence, appearing as a younger and slightly lower mass version of the nearby active, planet-hosting star AU Mic. Similar atmospheric properties were inferred in several independent studies (e.g., Mentuch et al. 2008; López-Valdivia et al. 2023), though not all of them agree (e.g., Yang et al. 2008; Nicholson et al. 2021; Pérez Paolino et al. 2025).
Photometric observations revealed that TWA 7 has a rotation period of 5.00 ± 0.03 d (Lawson & Crause 2005; Messina et al. 2010), with a modulation of amplitude ≃10 mmag. More recently, TWA 7 was monitored with TESS in 2019, 2021, 2023, and 2025, with data in the first three seasons showing modulation at the rotation period and additional stochastic fluctuations due to stellar flares or to satellite issues (in 2025). As a result of its relatively rapid rotation, TWA 7 was found to be strongly magnetic, with a small-scale field ranging from 2.2 to 2.7 kG (Yang et al. 2008; Lavail et al. 2019; López-Valdivia et al. 2023).
TWA 7 is surrounded by a complex debris disk viewed almost face-on, inclined at only i ≃13° to the line of sight (Ren et al. 2021). The debris disk of TWA 7 features several substructures, including distinct disk components, spiral arms, and a southern dust clump (Ren et al. 2021). The middle disk component, a very narrow ring located between the broad inner and outer disk rings, had been interpreted as a possible resonant structure triggered by an unseen planet companion. Recent observations revealed the presence of a sub-jovian candidate planet at the predicted location in the debris disk (about 52 au from the host star; Lagrange et al. 2025; Crotts et al. 2025).
Assuming that the stellar equatorial plane coincides with that of the disk implies that the spectral lines of TWA 7 are only weakly broadened by rotation despite the short Prot, with a line-of-sight projected equatorial rotation velocity v sin i= 2.1 ± 0.3 km s−1. The main stellar parameters used in our study are summarized in Table 1.
Parameters of TWA 7 used in our study.
3 SPIRou observations
We observed TWA 7 between 2019 February 14 and 2021 May 02, with the SPIRou nIR spectropolarimeter (Donati et al. 2020) at CFHT, within the SPIRou Legacy Survey (RUNIDs 19AP40, 20AP40, and 21AP40, PI J.-F. Donati). SPIRou collects unpolarized and polarized stellar spectra, covering a wavelength interval of 0.95−2.50 μm at a resolving power of 70 000 in a single exposure. Each observation usually consists of a sequence of four sub-exposures, with each sub-exposure corresponding to a different azimuth of the Fresnel rhomb retarders of the SPIRou polarimetric unit. With this procedure, we are able to remove systematics in polarization spectra to first order (Donati et al. 1997). Each recorded sequence yields one unpolarized (Stokes I) and one circularly polarized (Stokes V) spectrum, as well as one null polarization check (called N) used to diagnose potential instrumental or data reduction issues. We collected a total of 52 polarization sequences of TWA 7 over three consecutive observing seasons. One of them, obtained on 2020 Jan 26, was affected by an instrumental issue and discarded from the set, leaving us with a time series of 51 spectra spread over 808 d, 17 in 2019, 8 in 2020, and 26 in 2021. Total exposure times ranged from 670 s (in early 2019) to 1200 s in 2020 and 2021, while signal to noise ratios (S/Ns) per 2.3 km s−1 pixel in the H band spread from 134 to 365 (median 280).
We processed all spectra with Libre ESpRIT, the nominal reduction pipeline of ESPaDOnS at CFHT, optimized for spectropolarimetry and adapted for SPIRou (Donati et al. 2020). We then applied least-squares deconvolution (LSD; Donati et al. 1997) to the reduced spectra, using a line mask computed with the VALD-3 database (Ryabchikova et al. 2015) for a set of atmospheric parameters close to those of TWA 7 (Teff=3500 K, log g=4.5 cm s−2). We only selected atomic lines deeper than 10% of the continuum level, for a total of ≃1500 lines of average wavelength and Landé factor equal to 1750 nm and 1.2. This yielded noise levels, σV, in the resulting Stokes V LSD profiles ranging from 2.3 to 7.5 (median 3.1, in units of 10−4 Ic where Ic denotes the continuum intensity). Zeeman signatures were well detected, especially in 2020 and 2021, with average peak-to-peak amplitudes of 0.13%, 0.52%, and 0.76% in 2019, 2020, and 2021. We computed the longitudinal field, Bℓ, defined as the line-of-sight-projected vector magnetic field at the stellar surface averaged over the visible hemisphere, from LSD Stokes IV profiles following Donati et al. (1997), integrating over an interval of ± 30 km s−1 adequate for TWA 7. We found that Bℓ is unambiguously detected, with a reduced chi square (relative to Bℓ=0) of  . The same operation applied to the null polarization spectrum N yielded
  , consistent with no spurious signal down to the noise level and indicating no issues in the observation and reduction procedures. Bℓ was mostly negative in TWA 7, ranging from −253 to 4 G with a median error bar of 9.4 G (see Fig. 1), and exhibited moderate yet clear rotational modulation (see Sect. 4).
We also reduced our SPIRou data with the latest version of APERO (v0.7.294), the nominal SPIRou reduction pipeline (Cook et al. 2022) optimized for RV precision. We analyzed the APERO spectra with the line-by-line (LBL) technique (v0.65; Artigau et al. 2022), yielding accurate RVs and differential temperatures d T estimated from the variation of spectral lines with respect to their median profile (Artigau et al. 2024). We corrected these RVs for spectrograph drifts using the Fabry-Perot spectrum that SPIRou records simultaneously with the stellar spectrum (Donati et al. 2020). We found that RVs ranged from −17 to 25 m s−1 with a median error bar of 1.4 m s−1, while d T varied from −16 to 14 K with a median error bar of 3.0 K. We then used the d T measurements to infer a relative photometric light curve at SPIRou wavelengths (with temperature changes converted into brightness fluctuations with the Planck function), to be adjusted with ZDI along with the LSD profiles (see Sect. 5). We obtained light curves at SPIRou wavelengths with full amplitudes of ≃1%, similar to, and in phase with, those measured with TESS in the I band at similar epochs (2019 March and 2021 March). In addition to constraining the spot pattern, d T also indirectly informs on the small-scale field at the surface of TWA 7 and its variation with time via the tight correlation reported between both quantities for M dwarfs (Artigau et al. 2024; Cristofari et al. 2025).
The full log of our observations is provided in Table A.1. Phases and rotation cycles are derived assuming a rotation period of Prot=5.012 d (see Table 1), counting from an arbitrary starting barycentric Julian date (BJD) of 2 458 529 (slightly before our first observation of TWA 7).
Finally, we used our median unpolarized spectrum of TWA 7 to double check the atmospheric parameters with ZeeTurbo, a spectrum modeling tool specifically designed for characterizing nIR spectra of M dwarfs by comparing them to synthetic spectra computed from MARCS model atmospheres, including the Zeeman broadening of spectral lines induced by small-scale magnetic fields (Cristofari et al. 2023). For the stellar parameters, we found Teff=3435 ± 60 K, log g=4.28 ± 0.10, and a metallicity relative to the Sun, [Fe/H]=0.21 ± 0.10, in good agreement with Stassun et al. (2018). We also obtained that TWA 7 hosts a small-scale magnetic field, 〈 B〉=3.2 ± 0.3 kG, with the median stellar spectrum described as a linear combination of synthetic spectra with fields of strengths 0, 2, 4, 6, 8, and 10 kG components respectively covering relative fractions of the visible hemisphere equal to 0.18, 0.44, 0.17, 0.08, 0.05, and 0.08 (with typical error bars of a few 0.01). In this analysis, we fixed v sin i=2.1 km s−1 (see Table 1) while radial-tangential macroturbulence ζ was adjusted with all other parameters, yielding ζ=4.6 ± 0.1 km s−1. We show in Fig. A.1 the achieved fit to the K band of the spectrum.
Previous studies derived a weaker small-scale field, of 2.3 kG (Yang et al. 2008, data from 2000) and 2.7 kG (Lavail et al. 2019, data from 2008 and 2009), with a similar technique limited to fewer model components (0, 2, 4, and 6 kG for Yang et al. 2008, and 0, 2, and 4 kG for Lavail et al. 2019), stronger ones being unnecessary on the grounds of the Bayesian information content (BIC, Lavail et al. 2019). Our observations, however, suggest that the strongest field components are required, yielding a smaller BIC value when included. This possibly suggests that the smallscale field changed between the different measurement epochs. Alternatively, the far wings of the magnetically sensitive lines of our median TWA 7 spectrum may suffer normalization issues, rendering the additional small-scale field from the highest field components less reliable. We did not detect rotational modulation of <B> by looking at individual spectra of TWA 7. This is not surprising given the low value of i and the low amplitude modulation of d T (see Sect. 4), suggesting a modulation amplitude of order 0.1 kG for <B> (judging from the correlation between d T and 〈 B〉).
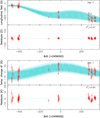 |
Fig. 1 Longitudinal magnetic field Bℓ (top panel) and temperature variations d T (bottom panel) of TWA 7 (red dots) and the QP GPR fit to the data (cyan full line) with the corresponding 68% confidence intervals (cyan dotted lines). The residuals, shown in the bottom plot of each panel, yielded rms of 8.2 G and 2.9 K ( |

4 Magnetic field and temperature changes
We used the framework of Haywood et al. (2014) and Rajpaul et al. (2015) to perform a quasiperiodic (QP) Gaussian process regression (GPR) fit to the Bℓ values, arranged in a vector denoted y. For this purpose, we employed the QP covariance function c(t, t′):
 (1)
(1)
where θ1 is the amplitude (in G) of the Gaussian process (GP), θ2 its recurrence period (measuring Prot), θ3 the evolution timescale on which the Bℓ curve changes shape (in d), and θ4 is a smoothing parameter describing the amount of allowed harmonic complexity (the smaller θ4, the larger the complexity, with θ4>1 implying a nearly sinusoidal fluctuation over a timescale of θ3). A fifth hyperparameter, θ5, describes the excess uncorrelated noise required to obtain the QP GPR fit to the Bℓ data with the highest likelihood ℒ, defined by
 (2)
(2)
where C is the covariance matrix for all observing epochs; Σ is the diagonal variance matrix associated with  is the contribution of the additional white noise, with J the identity matrix; and n is the number of data points.
With a Markov Chain Monte Carlo (MCMC) process, we explored the hyperparameter domain, yielding posterior distributions and error bars for each. The MCMC and GPR modeling tools are those used in our previous studies (e.g., Donati et al. 2023). The MCMC process is based on a conventional single chain Metropolis-Hastings scheme, typically running over a few 105 steps, including the first few 104 steps as burn-in. Convergence was checked with an autocorrelation analysis, verifying that the burn-in and main phase vastly exceed the autocorrelation lengths of all parameters. As in Haywood et al. (2014), we computed the marginal logarithmic likelihood log ℒM of a given solution following Chib & Jeliazkov (2001).
The GPR fit we obtained is shown in the top panel of Fig. 1, with a zoom on the 2021 data in Fig. B.1. The derived GPR hyperparameters are listed in the top section of Table 2. We found that Bℓ variations came mostly from the seasonal evolution of the large-scale field between 2019 and 2020. Rotational modulation was moderate, as expected from the low inclination of the stellar rotation axis to the line of sight, but is nonetheless clearly detected in 2020 and 2021, with a typical semi-amplitude of ≃50 G.
We performed a similar analysis on the d T measurements (see bottom panel of Fig. 1 and bottom section of Table 2). Rotational modulation dominated the temperature variations of TWA 7 during our observations, and is clearly detected with a typical semi-amplitude of 5−7 K. The seasonal changes were weaker, suggesting that the spot pattern and the underlying small-scale field <B> did not vary much over our campaign. This contrasts with the large seasonal Bℓ variations over the same period, suggesting a year-to-year change in the large-scale field topology but not in its small-scale intensity (Bℓ being very sensitive to field orientation as opposed to 〈B〉). As for AU Mic (Donati et al. 2025b), d T and Bℓ are poorly correlated (Pearson’s coefficient ≃−0.3). The recurrence period derived for Bℓ and d T agree well, and match literature values (Lawson & Crause 2005; Messina et al. 2010) with smaller error bars.
5 ZDI modeling
We used our LSD Stokes IV profiles in each of the three seasons, in addition to the photometric constraints derived from dT, to derive maps of the large-scale magnetic field and photospheric brightness at the surface of TWA 7 with ZDI. Including both LSD Stokes I and V (rather than Stokes V only) profiles in the ZDI modeling is essential to ensure that the Zeeman broadening of line profiles is well reproduced and that the reconstructed field is not severely underestimated (e.g., Donati et al. 2025a). In practice, ZDI operates as outlined in previous studies. Beginning with empty magnetic maps and brightness distributions, ZDI iteratively adds information on both images, exploring the parameter space with conjugate gradient techniques and comparing the synthetic Stokes profiles of the current images with observed ones at each iteration, until it reaches the requested level of agreement with the data (i.e., a given  ).
).
We divided the surface of TWA 7 into 5000 grid cells, associating each with a value of the local surface brightness (relative to the quiet photosphere). We described the magnetic topology with a spherical harmonics (SH) expansion using the formalism of Donati et al. (2006) in its revised implementation (Lehmann & Donati 2022; Finociety & Donati 2022), where the poloidal and toroidal components of the vector field are expressed with three sets of complex SH coefficients, αℓ, m and βℓ, m for the poloidal component, and γℓ, m for the toroidal component (with ℓ and m denoting the degree and order of the corresponding SH term in the expansion). Given the low v sin i of TWA 7, we limited the SH expansion to ℓ=5. With more parameters than independent data points, the inversion problem is ill-posed, requiring some regularization. ZDI chooses the simplest of all solutions, i.e., the one with minimum information or maximum entropy that matches the data at the requested  level, following the approach of Skilling & Bryan (1984). We assumed TWA 7 rotates as a solid body. Although latitudinal differential rotation is in principle accessible to ZDI (e.g., Finociety et al. 2023b), measuring it on stars viewed nearly pole-on with low v sin i like TWA 7 is hardly feasible and not reliable.
We used Unno-Rachkovsky’s equation of the polarized radiative transfer equation in a plane-parallel Milne-Eddington atmosphere (Landi degl’Innocenti & Landolfi 2004) to compute local synthetic Stokes IV profiles for each grid cell. At each observed rotation phase, we summed the spectral contributions from all visible cells (assuming a linear center-to-limb darkening law for the continuum, with a coefficient of 0.3) to obtain the overall synthetic profiles, whose mean wavelength and Landé factor are mirrored from those of our LSD profiles, i.e., 1750 nm and 1.2. We assumed a Doppler width of the local profile of vD=2.0 km s−1, yielding the best fit to the Stokes I profiles. As in previous studies, we introduced a filling factor for the large-scale field, fV, and another one for the small-scale field, fI, both assumed constant over the star. It implies that each cell with a reconstructed field B hosts a field strength B/fV in a fraction of the cell equal to fV and fI for Stokes V and I profiles, respectively. For this study, we set fI=0.8 (consistent with the results of ZeeTurbo, see Sect. 3) and fV=0.2 (as for other similar young stars, including AU Mic; Donati et al. 2025b). We computed synthetic light curves in a similar way, by summing the photometric contributions of all visible cells, estimated from their local brightness and limb angle at each observed rotation phase.
The fits to the LSD Stokes IV profiles of TWA 7 derived with ZDI for each of the three epochs are shown in Fig. 2, the corresponding reconstructed maps are presented in Fig. 3, and their main characteristics listed in Table 3. The brightness maps we simultaneously recovered only showed low-contrast features, in agreement with the low-amplitude photometric curves derived from d T measurements (see Fig. C.1).
The derived magnetic topology was mostly poloidal at all epochs, with the dipole component encompassing 82-89% of the reconstructed poloidal field energy, and resembled that inferred for AU Mic (Donati et al. 2025b,a). The main topological change occurred between 2019 and 2020, as expected from the large increase in the amplitude of LSD Stokes V signatures (see Fig. 2). Throughout the observing campaign, the reconstructed field of TWA 7 got simpler, less tilted with respect to the rotation axis, and more dipolar. The polar strength of the dipole increased from 0.48 to 0.69 kG from 2019 to 2021, while its polarity remained negative. The toroidal field was weak (5-8% of the reconstructed field energy), close to the detection level, and switched polarity between 2019 and 2021 a potential signature of a cyclic evolution of the large-scale field.
The small-scale field 〈 Bs〉 inferred with ZDI (2.2 kG) remained more or less stable throughout the campaign, as did d T (see Sect. 4), presumably a good proxy for 〈 B〉 (Artigau et al. 2024; Cristofari et al. 2025). The ZDI analysis thus confirmed the preliminary conclusions of Sect. 4 that the magnetic field evolution of TWA 7 over our observing period mostly concerned the large-scale topology rather than the average strength of the small-scale field. We note that 〈 Bs〉 is weaker than the <B> estimate directly derived with ZeeTurbo (3.2 ± 0.3 kG) for some unclear reason, despite numerous attempts to reach a better agreement by tuning the model parameters. It suggests that ZDI did not fully succeed at fitting the farthest wings of the LSD profiles of TWA 7. We had no such issue in our previous study on magnetic topologies of two active M dwarfs from all Stokes parameters (Donati et al. 2025a), where the small-scale fields were either similar in strength or even stronger than that of TWA 7 but with a different distribution of field strengths and filling factors over the surface. The derived 〈 Bs〉 is nonetheless consistent with some of the small-scale field measurements previously reported for TWA 7 (Yang et al. 2008).
Results of the Markov Chain Monte Carlo modeling of the Bℓ (top) and d T (bottom) curves of TWA 7.
6 RV modeling
We analyzed the RVs of TWA 7 inferred by LBL, looking for a potential RV signal from a close-in giant planet. We proceeded as in Sect. 4, using GPR to model the activity jitter in the RV curve and a simple sine wave to describe the RV signature of the putative close-in planet (assumed to be on a circular orbit). This implied a total of seven parameters to be fitted, four for the activity jitter (with θ4 fixed as for d T) and three for the close-in planet (the orbital period Pb, the semi-amplitude of the RV signature Kb, and the BJD of the second conjunction Tb). Posterior distributions for all parameters are derived with a MCMC process, while the robustness of a given planet signal is estimated from the variation in marginal likelihood Δ log ℒM relative to the model with no planet. We did not take into account the newly discovered distant planet in our modeling, its orbital period (of about 550 yr for a semimajor axis of 52 au) being much longer than that of our observations.
We started by modeling activity, showing up clearly in the RV data at a level of 5−10 m s−1, and noticed that, once removed, some power was still present in the periodogram of RV residuals around periods of 15, 20, and 30 d (and their 1−yr and 2−yr aliases). We limited our analysis to periods up to ≃50 d, i.e., those showing the strongest peaks and the only ones we could reliably investigate given the moderate sampling of our data in individual seasons. We first used a wide prior for Pb to find out which period among all aliases was the most likely, then narrow priors to focus on the main peaks. We found that the strongest signal was located at Pb=15.21 ± 0.02 d, while those at 20.8 d (presumably its 2-month alias) and at 30.4 d (its first multiple) were both less likely. The parameters and error bars of the best models are listed in Table 4, while the plot associated with the 15.21-d planet model is shown in Fig. 4 (with a zoom on the 2021 data in Fig. D.1).
The most likely model with a planet (at an orbital period of 15.21 d) fits the RV data much better than that featuring activity only, with 1.7 times smaller RV residuals and a logarithmic Bayes factor, log BF=Δ log ℒM=11.4 (3.4 and 2.7 higher than the models with planet at orbital periods of 20.8 and 30.4 d, respectively, see Table 4). The corresponding semiamplitude of the planet RV signature,  , implies a planet minimum mass Mb sin i
  , i.e., a planet mass
  assuming an inclination of the orbital axis to the line of sight equal to that of the disk (i=13°.; Ren et al. 2021), while the derived orbital period translates into an orbital distance of ab=0.092 ± 0.006 au. Figure 5 shows the corresponding periodograms of the raw, filtered, and residual RVs, as well as the stacked periodogram of the filtered RVs illustrating that the 15.21-d peak strengthens as more data are added, as expected for a planet signature. The phase-folded curve of the filtered RVs is shown in Fig. 6. The derived planet mass is similar in the case of the 20.8−d model planet orbiting at 0.114 au, and increases to 0.28 M4 for the 30.4-d model planet at 0.147 au (see Table 4).
However, we emphasize that Pb is close to half the period of the main one-month peak in the window function (located at 32.0 d, see Fig. 5), and to three times that of the stellar rotation period, flagging the putative planet signal as potentially spurious despite the large Bayes factor. Moreover, the decay time of the activity jitter, θ2, now needed to be an order of magnitude shorter than the one derived from Bℓ and d T (see Table 2) so that RV variations, in particular those in 2019 and 2021, were well adjusted. This suggested that some of the RVs might be affected by systematics. Looking at how RVs vary with the barycentric Earth RV (BERV) revealed that RVs are slightly larger around BERV ≃9 km s−1. Repeating the whole analysis without the two high RV points collected on 2019 February 25 and 26 near this BERV reduced the Bayes factor to Δ log ℒM=6.2. Last but not least, fitting the RV and d T measurements simultaneously with a bidimensional GP to further constrain the planet parameters (as advocated by Rajpaul et al. 2015) yielded different relative likelihoods for the planet models (the one with a period of 30.4 d becoming the most likely) and a marginally significant Bayes factor for the best model (Δ log ℒM=5.5). For all these reasons, we consider this potential detection as tentative at best, until more data are available.
Finally, we ran injection recovery tests on the LBL RVs of TWA 7 for planets with orbital periods ranging from 6 to 35 d and different conjunction epochs, and found that Kb values of ≃5 m s−1 were recovered with an average log BF ≃5, while cases with Kb ≃10 m s−1 were always detected with an average log BF of ≃14. The log BF ≃5 threshold translates to planet masses of 0.12, 0.16, and 0.20 M4 for respective orbital periods of 7, 15, and 30 d, further confirming that the tentative signal reported above is very close to the detection limit of our data even though the inferred log BFs at the specific planet parameters mentioned in Table 4) are well above the threshold.
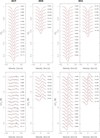 |
Fig. 2 Observed (thick black line) and modeled (thin red line) LSD Stokes I (top row) and V (bottom row) profiles of TWA 7 for seasons 2019, 2020, and 2021 (from left to right). Rotation cycles (counting from 0, 71, and 147, for seasons 2019, 2020, and 2021, respectively, see Table A.1) are indicated to the right of the LSD profiles, and the ± 1 σ error bars are shown to the left of the Stokes V profiles. |
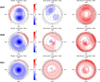 |
Fig. 3 Reconstructed maps of the large-scale field of TWA 7 showing the radial, azimuthal and meridional components in spherical coordinates (left, middle and right columns, units in G) for season 2019, 2020, and 2021 (top to bottom rows, respectively). These maps, derived from the LSD Stokes IV profiles of Fig. 2 using ZDI, are displayed in a flattened polar projection down to latitude −13°; the north pole is at the center and the equator is depicted as a bold line. Outer ticks mark the phases of observations. Positive radial, azimuthal, and meridional fields point outward, counterclockwise, and poleward, respectively. |
Properties of the large-scale and small-scale field for the magnetic topologies reconstructed with ZDI for all three seasons.
Markov Chain Monte Carlo results of the RV modelling.
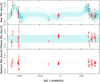 |
Fig. 4 Raw (top), filtered (middle), and residual (bottom) RVs of TWA 7 (red dots) over the observing period. The top plot shows the MCMC fit to the data, including a QP GPR modeling of the activity and a tentative planet on a 15.21-d circular orbit (cyan). The middle plot shows the tentative planet RV signature (cyan) once activity was filtered out. The rms of the residuals is 2.8 m s−1. A zoom in on the 2021 data is shown in Fig. D.1. |
7 Activity
We also looked at specific lines in the SPIRou spectra of TWA 7, in particular the 1083 nm He I infrared triplet (IRT) and the 1282 nm Pa β line known to be reliable chromospheric activity proxies in low-mass stars. The He I IRT exhibited a typical average equivalent width (EW) of ≃1.6 km s−1 and only a small amount of variability at an rms level of a few percent of the continuum, with a standard deviation profile featuring a Gaussian shape with a full width at half maximum (FWHM) of ≃30 km s−1. We saw TWA 7 flare at one epoch only (2020 May 08), with emission in the He I core reaching an EW of 6.7 km s−1 and a FWHM of 60 km s−1. To investigate these fluctuations in more detail, we computed differential He I spectra by dividing all observations by their median, and derived the EW changes through a Gaussian fit to the differential spectra (see Table A.1), assuming a fixed centroid and FWHM (set to 0 and 50 km s−1, respectively) as in previous works (e.g., Finociety et al. 2023a; Donati et al. 2025b). A periodogram of these EW changes (excluding the flare) yielded a peak at a period of 6.6 d with a false-alarm probability (FAP) level of 0.06%, accompanied by a slightly weaker one at 8.3 d (presumably the 1 -month alias of the main one), rather than at the stellar rotation period. A QP GPR fit to the same EW changes converged on a period of 6.51 ± 0.07 d for the main peak when assuming an evolution timescale of 250 d (similar to that of Bℓ and d T, see Table 2), and 6.62 ± 0.06 d assuming a much longer evolution timescale (as for the periodogram). The semi-amplitude of these EW changes was equal to 1.2 ± 0.3 km s−1, with maximum emission occurring at a BJD of 2459298.15. This period of 6.6 d and its 8.3 d alias were even clearly visible in the 2D periodogram of the 2021 He I profiles of TWA 7 (see Fig. 7).
We found that Pa β, with an EW of 4.0 km s−1, was slightly stronger than in AU Mic (where EW=3.3 km s−1). It showed much weaker temporal variability than He I at a precision level of 0.3 km s−1 rms in EW, confirming that TWA 7 is no longer accreting material from its debris disk at a detectable rate. The flare detected in He I barely showed up in Pa β. Carrying out a GPR fit to the Pa β EW changes with respect to the median profile nonetheless revealed the same periodicity than with He I albeit with a larger error bar (6.52 ± 0.12 d) and a lower semi amplitude of fluctuations (0.3 ± 0.1 km s−1). The Pa β and He I EW changes were reasonably well correlated given the noise (R ≃0.6) and varied in phase during our observations. It confirmed that the detected period was real although undetected in other activity proxies. Its origin is unclear at this stage.
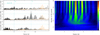 |
Fig. 5 Periodogram and stacked periodogram of the RV data. Left panel: periodogram of the raw (top), filtered (middle), and residual (bottom) RV data, including a tentative planet on a 15.21-d circular orbit in the MCMC modeling. Dashed vertical cyan lines trace the stellar rotation period and the orbital period of the tentative planet, while the dashed horizontal line indicates a 0.1% false-alarm probability (FAP, computed following Press et al. 1992) in the periodogram of the RV data. No significant signal remains in the residual RVs at the main stellar and tentative planet periods (and their aliases). The orange curve depicts the periodogram of the window function. A version of this plot with frequencies on the x-axis is also provided in Fig. D.2. Right panel: stacked periodogram of the filtered RVs as a function of the number of RV points included in the Fourier analysis, beginning from the first observation. The color scale indicates the logarithmic power in the periodogram. The vertical dashed line traces the orbital period of the tentative planet. |
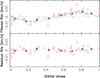 |
Fig. 6 Phase-folded filtered (top) and residual (bottom) RVs for the model with a tentative planet on a 15.21-d circular orbit. Red dots show the individual RV measurements with their error bars, while black stars indicate average RVs over eight even phase bins. As in Fig. 4, the dispersion of RV residuals is 2.8 m s−1. |
8 Discussion
We observed TWA 7 with SPIRou at CFHT in an attempt to better characterize the star, its large- and small-scale magnetic fields, and its activity pattern and to search for potential close-in planets in the inner regions of its debris disk. Being much younger than another well-studied young M dwarf, AU Mic, hosting both a debris disk and a multiplanet system (Donati et al. 2025b), makes TWA 7 a key target and an interesting comparison point in the study of evolving young low-mass planet-hosting stars. We obtained 51 Stokes IV spectra of TWA 7 over 808 d covering three consecutive seasons (2019-2021), with about half of them recorded in 2021.
We detected both the large- and small-scale magnetic fields of TWA 7. We found that the longitudinal field Bℓ varied from average values of −34 G in 2019 to −163 G in 2020 and −205 G in 2021. Rotational modulation, although moderate at all epochs (semi-amplitude ≃50 G), was nonetheless detected clearly, with a modulation period of 5.012 ± 0.007 d, in agreement with literature estimates (e.g., Lawson & Crause 2005). A consistent rotation period (5.016 ± 0.010 d) was also measured from the temperature change, d T, of TWA 7 derived by LBL, modulated with a semi-amplitude of ≃5 K. The small-scale magnetic field, inferred with ZeeTurbo from the Zeeman broadening of atomic lines (Cristofari et al. 2023), was equal to 3.2 ± 0.3 kG, which is slightly larger than previously published measurements (e.g., Yang et al. 2008; Lavail et al. 2019).
Modeling the large-scale field of TWA 7 with ZDI from LSD Stokes IV profiles and d T measurements simultaneously yielded a mainly poloidal and axisymmetric magnetic topology, whose main component was a dipole of polar strength varying from −0.48 kG (in 2019) to −0.69 kG (in 2021), tilted at an angle of ≃20° to the rotation axis. We also reconstructed a weak toroidal component that switched polarity between 2019 and 2020; this is possibly an indication of a longer-term cyclic behavior of the large-scale field. The small-scale field inferred from the same modeling was equal to 〈 Bs〉 ≃2.2 kG at all epochs, which is smaller than the direct estimate with ZeeTurbo but consistent with the range of published values. The absence of seasonal variations of 〈 B〉 also agreed with the stationary d T, a reportedly reliable proxy for 〈 B〉 (Cristofari et al. 2025).
The reconstructed large-scale field of TWA 7 is consistent with that of similarly young active M dwarfs (e.g., Donati et al. 2025a). It is much stronger than the field derived for the same star from visible spectropolarimetric data collected in 2017 (Nicholson et al. 2021), featuring a weak dipole and a positive polarity of the radial field in the visible hemisphere. We suspect that this difference mostly comes from temporal variability, further suggesting that the large-scale field of TWA 7 undergoes long-term and possibly cyclic variations. This difference may also partly reflect that that study was based on data collected with HARPS-Pol at visible wavelengths, an instrument that is much less sensitive to large-scale magnetic fields than SPIRou for an M dwarf. Further observations aimed at monitoring the magnetic field of TWA 7 on a longer timescale with SPIRou could confirm whether the large-scale field indeed exhibits a Sun-like cycle with global polarity switches of its poloidal and toroidal components. If confirmed, this would give us the opportunity to study the dynamo-generated magnetic cycle of a very young star for the first time.
We found that the RVs of TWA 7 also show small rotational modulation (semi-amplitude ≃5 m s−1) and dominant fluctuations from another source, with maximum power at periods of 15.2, 20.8, and 30.4 d. One explanation is that TWA 7 hosts a close-in planet in a circular orbit, most likely with an orbital period of Pb=15.21 ± 0.02 d and a semi-amplitude of  , with a Bayes factor relative to the planet-free model large enough to qualify as a reliable detection. Assuming an orbital inclination similar to that of the debris disk (13°.; Ren et al. 2021), this candidate planet would correspond to a mini Saturn planet of mass
  at an orbital distance of 0.092 ± 0.006 au from TWA 7. However, due to Pb being close to half that of the one-month peak in the window function of our observations (located at 32.0 d) and to three times the rotation period of the host star, this detection may be spurious despite its statistical significance. Some of the RV fluctuations may also reflect systematics, possibly caused by residuals of telluric lines given that RVs tend to be slightly larger around BERV ≃9 km s−1. In addition, injection recovery tests for putative planets with orbital periods in the range 6 to 35 d and different conjunction epochs indicate that firm statistical detection requires, on average, Kb>8 m s−1 to obtain log BF>10, confirming that the tentative RV signal reported in this paper is very close to the reliable detection limit of our data. For these reasons, we consider the detection of this candidate planet only as tentative until further data are available to either validate or reject it. If confirmed, the derived candidate planet would have about half the mass of that recently detected in the outer parts of the debris disk (Lagrange et al. 2025). Its existence would demonstrate that protoplanetary disks are able to generate both distant and close-in massive planets, which would be an interesting constraint for planetary formation models.
From examination of the temporal changes of the 1083 nm He I IRT and 1282 nm Pa β line of TWA 7 relative to their median profiles over the 808 d of the SPIRou observations, we found that the He I IRT exhibited clear fluctuations at a level of a few percent of the continuum, with EWs varying with a semiamplitude of 1.2 ± 0.3 km s−1 and a period of 6.6 d but not at the stellar rotation period. This 6.6 d period was even clearly visible in the 2D periodogram of the 2021 He I spectra. We also detected a flare at one epoch (2020 May 08) where the EW of He I reached 6.7 km s−1. In contrast, Pa β featured only very small EW fluctuations, at an rms level of ≃0.3 km s−1, confirming that TWA 7 is no longer accreting from the central regions of its debris disk. The 6.6 d period seen in the He I IRT was nonetheless detectable in the Pa β EW changes, in phase with He I EW changes and with a typical semi-amplitude of 0.3 ± 0.1 km s−1. This period was not detected in the other activity proxies (Bℓ and d T) nor in the RVs, rendering its origin unclear. We note that this period is equal to the beat period (of 6.60 d) between Prot and the 20.8−d signal linked to the tentative planet mentioned in Sect. 6, suggesting potential star-planet magnetospheric interactions occurring between TWA 7 and a putative close-in planet at a distance of 0.11 au. Given the large-scale topology we recovered and assuming a wind from TWA 7 similar to that of AU Mic (Kavanagh et al. 2021), we find that the Alfven radius of TWA 7 should extend beyond 0.11 au (to ensure a sub-Alfvenic wind regime) for mass-loss rates less than 250 Ṁ⊙. Alternatively, the detected 6.6 d period could reflect the planet rotation period directly, although it is not clear how the planet itself could generate emission modulation in He I and Pa β lines at a level much stronger than the host star. In this case, it may suggest that the planet also orbits at a period of 6.6 d, i.e., with rotation synchronized on orbital motion. From injection recovery tests, the non-detection of this period in the RV SPIRou data implies an upper limit on the planet mass of ≃0.12 M♃.
Being a younger (and slightly less massive) version of AU Mic, TWA 7 is one of the few and very best objects for studying newly born low-mass stars, their planets, and debris disks at an age of ≃10 Myr. Its location in TWA at a distance of 33 pc makes it much more accessible than, for example, the even younger planet-hosting low-mass star IRAS 04125+2902 (Barber et al. 2024; Donati et al. 2025c), allowing for the collection of higher quality data and therefore infer more stringent constraints on planetary formation despite the low inclination of the disk rotation axis of TWA 7 to the line of sight. Although we are unable to reach a definitive conclusion about the presence of a close-in planet around TWA 7 from our first set of 51 SPIRou spectra covering 808 d, we derived an upper limit on the mass of such a planet (of about half that of the recently detected distant one), and we detected an enigmatic 6.6 d period signal in He I and Pa β lines that may relate to the existence of such a planet. More observations are required to progress on this front, which will also enable the magnetic evolution of TWA 7 to be studied on a longer timescale, as it may be featuring a Sun-like dynamo cycle with reversing polarities of its poloidal and toroidal components. We thus advocate for a coordinated multi-instrument multiwavelength monitoring effort of TWA 7 over the coming years to characterize in detail the star and its planetary system.
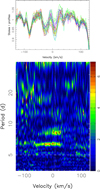 |
Fig. 7 Stacked Stokes I profiles (top panel) and 2D periodogram (bottom panel) of the 1083.3-nm He I IRT in the stellar rest frame for the 2021 spectra of TWA 7. The dashed horizontal line traces Prot and the vertical dotted lines depict the velocities of the three components of the He I triplet. The color scale traces the logarithmic power in the periodogram. Only the main peaks (colored yellow to red and extending over at least several velocity bins) are likely to be significant. |
Data availability
SPIRou data used in this study are publicly available at the Canadian Astronomy Data Center (https://www.cadc-ccda.hia-iha.nrc-cnrc.gc.ca).
Acknowledgements
We thank an anonymous referee for carefully reading the manuscript and suggesting valuable modifications and clarifications. This work benefited from the SIMBAD CDS database at URL http://simbad.u-strasbg.fr/simbad and the ADS system at URL https://ui.adsabs.harvard.edu. Our study is based on data obtained at the CFHT, operated by the CNRC (Canada), INSU/CNRS (France) and the University of Hawaii. This project received funds from the Agence Nationale pour la Recherche (ANR, project ANR-24-CE49-3397 ORVET) and the Investissements d’Avenir program of Grenoble-Alpes University (project ANR-15-IDEX-02 Origin of Life). The authors wish to recognise and acknowledge the very significant cultural role and reverence that the summit of Maunakea has always had within the indigenous Hawaiian community.
References
- André, P., Di Francesco, J., Ward-Thompson, D., et al. 2014, in Protostars and Planets VI, eds. H. Beuther, R. S. Klessen, C. P. Dullemond, & T. Henning, 27 [Google Scholar]
- Artigau, É., Cadieux, C., Cook, N. J.,, et al. 2022, AJ, 164, 84 [NASA ADS] [CrossRef] [Google Scholar]
- Artigau, É., Cadieux, C., Cook, N. J.,, et al. 2024, AJ, 168, 252 [Google Scholar]
- Baraffe, I., Homeier, D., Allard, F., & Chabrier, G., 2015, A&A, 577, A42 [NASA ADS] [CrossRef] [EDP Sciences] [Google Scholar]
- Barat, S., Désert, J.-M., Goyal, J. M.,, et al. 2024, A&A, 692, A198 [NASA ADS] [CrossRef] [EDP Sciences] [Google Scholar]
- Barber, M. G., Thao, P. C., Mann, A. W., et al. 2024, ApJ, 973, L30 [Google Scholar]
- Bouvier, J., Matt, S. P., Mohanty, S., et al. 2014, Protostars and Planets VI, 433 [NASA ADS] [Google Scholar]
- Chib, S., & Jeliazkov, I., 2001, J. Am. Statist. Assoc., 96, 270 [Google Scholar]
- Cody, A. M., Stauffer, J., Baglin, A., et al. 2014, AJ, 147, 82 [Google Scholar]
- Cook, N. J., Artigau, É., Doyon, R.,, et al. 2022, PASP, 134, 114509 [NASA ADS] [CrossRef] [Google Scholar]
- Cristofari, P. I., Donati, J. F., Folsom, C. P., et al. 2023, MNRAS, 522, 1342 [NASA ADS] [CrossRef] [Google Scholar]
- Cristofari, P. I., Donati, J.-F., Bellotti, S., et al. 2025, A&A, 702, A111 [NASA ADS] [CrossRef] [EDP Sciences] [Google Scholar]
- Crotts, K. A., Carter, A. L., Lawson, K., et al. 2025, ApJ, 987, L41 [Google Scholar]
- David, T. J., Petigura, E. A., Luger, R., et al. 2019, ApJ, 885, L12 [Google Scholar]
- Donati, J.-F., Semel, M., Carter, B. D., Rees, D. E., & Collier Cameron, A., 1997, MNRAS, 291, 658 [NASA ADS] [CrossRef] [Google Scholar]
- Donati, J.-F., Howarth, I. D., Jardine, M. M., et al. 2006, MNRAS, 370, 629 [NASA ADS] [CrossRef] [Google Scholar]
- Donati, J. F., Kouach, D., Moutou, C., et al. 2020, MNRAS, 498, 5684 [Google Scholar]
- Donati, J. F., Cristofari, P. I., Finociety, B., et al. 2023, MNRAS, 525, 455 [NASA ADS] [CrossRef] [Google Scholar]
- Donati, J. F., Finociety, B., Cristofari, P. I., et al. 2024, MNRAS, 530, 264 [NASA ADS] [CrossRef] [Google Scholar]
- Donati, J. F., Cristofari, P. I., Klein, B., Finociety, B., & Moutou, C. 2025a, A&A, 700, A122 [NASA ADS] [CrossRef] [EDP Sciences] [Google Scholar]
- Donati, J. F., Cristofari, P. I., Moutou, C., et al. 2025b, A&A, 700, A227 [NASA ADS] [CrossRef] [EDP Sciences] [Google Scholar]
- Donati, J. F., Gaidos, E., Moutou, C., et al. 2025c, A&A, 698, L14 [NASA ADS] [CrossRef] [EDP Sciences] [Google Scholar]
- Drążkowska, J., Bitsch, B., Lambrechts, M., et al. 2023, in Astronomical Society of the Pacific Conference Series, 534, Protostars and Planets VII, eds. S. Inutsuka, Y. Aikawa, T. Muto, K. Tomida, & M. Tamura, 717 [Google Scholar]
- Feiden, G. A., 2016, A&A, 593, A99 [NASA ADS] [CrossRef] [EDP Sciences] [Google Scholar]
- Finociety, B., & Donati, J. F., 2022, MNRAS, 516, 5887 [NASA ADS] [CrossRef] [Google Scholar]
- Finociety, B., Donati, J. F., Cristofari, P. I., et al. 2023a, MNRAS, 526, 4627 [Google Scholar]
- Finociety, B., Donati, J. F., Grankin, K., et al. 2023b, MNRAS, 520, 3049 [Google Scholar]
- Gaia Collaboration, 2020, VizieR Online Data Catalog: Gaia EDR3 (Gaia Collaboration, 2020), VizieR On-line Data Catalog: I/350. Originally published in: 2021A&A...649A...1G [Google Scholar]
- Haffert, S. Y., Bohn, A. J., de Boer, J., et al. 2019, Nat. Astron., 3, 749 [Google Scholar]
- Haywood, R. D., Collier Cameron, A., Queloz, D., et al. 2014, MNRAS, 443, 2517 [Google Scholar]
- Husser, T. O., Wende-von Berg, S., Dreizler, S., et al. 2013, A&A, 553, A6 [NASA ADS] [CrossRef] [EDP Sciences] [Google Scholar]
- Kavanagh, R. D., Vidotto, A. A., Klein, B., et al. 2021, MNRAS, 504, 1511 [Google Scholar]
- Lagrange, A. M., Wilkinson, C., Mâlin, M., et al. 2025, Nature, 642, 905 [Google Scholar]
- Landi degl’Innocenti, E., & Landolfi, M., 2004, Polarisation in Spectral Lines (Dordrecht/Boston/London: Kluwer Academic Publishers) [Google Scholar]
- Lavail, A., Kochukhov, O., & Hussain, G. A. J., 2019, A&A, 630, A99 [NASA ADS] [CrossRef] [EDP Sciences] [Google Scholar]
- Lawson, W. A., & Crause, L. A., 2005, MNRAS, 357, 1399 [Google Scholar]
- Lebreuilly, U., Hennebelle, P., Colman, T., et al. 2024, A&A, 682, A30 [NASA ADS] [CrossRef] [EDP Sciences] [Google Scholar]
- Lehmann, L. T., & Donati, J. F., 2022, MNRAS, 514, 2333 [CrossRef] [Google Scholar]
- Lin, D. N. C., Bodenheimer, P., & Richardson, D. C., 1996, Nature, 380, 606 [Google Scholar]
- López-Valdivia, R., Mace, G. N., Han, E., et al. 2023, ApJ, 943, 49 [CrossRef] [Google Scholar]
- Luhman, K. L., 2023, AJ, 165, 269 [NASA ADS] [CrossRef] [Google Scholar]
- Martioli, E., Hébrard, G., Correia, A. C. M., Laskar, J., & Lecavelier des Etangs, A. 2021, A&A, 649, A177 [NASA ADS] [CrossRef] [EDP Sciences] [Google Scholar]
- Mentuch, E., Brandeker, A., van Kerkwijk, M. H., Jayawardhana, R., & Hauschildt, P. H., 2008, ApJ, 689, 1127 [NASA ADS] [CrossRef] [Google Scholar]
- Messina, S., Desidera, S., Turatto, M., Lanzafame, A. C., & Guinan, E. F., 2010, A&A, 520, A15 [NASA ADS] [CrossRef] [EDP Sciences] [Google Scholar]
- Mulders, G. D., Pascucci, I., & Apai, D., 2015, ApJ, 798, 112 [Google Scholar]
- Nicholson, B. A., Hussain, G., Donati, J. F., et al. 2021, MNRAS, 504, 2461 [NASA ADS] [CrossRef] [Google Scholar]
- Pérez Paolino, F., Bary, J. S., Hillenbrand, L. A., Horner, B., & Carvalho, A. 2025, ApJ, 990, 205 [Google Scholar]
- Press, W. H., Teukolsky, S. A., Vetterling, W. T., & Flannery, B. P., 1992, Numerical recipes in C. The art of scientific computing [Google Scholar]
- Rajpaul, V., Aigrain, S., Osborne, M. A., Reece, S., & Roberts, S., 2015, MNRAS, 452, 2269 [Google Scholar]
- Ren, B., Choquet, É., Perrin, M. D.,, et al. 2021, ApJ, 914, 95 [CrossRef] [Google Scholar]
- Romanova, M. M., & Lovelace, R. V. E., 2006, ApJ, 645, L73 [Google Scholar]
- Romanova, M. M., Lii, P. S., Koldoba, A. V., et al. 2019, MNRAS, 485, 2666 [Google Scholar]
- Romanova, M. M., Koldoba, A. V., Ustyugova, G. V., et al. 2021, MNRAS, 506, 372 [NASA ADS] [CrossRef] [Google Scholar]
- Ryabchikova, T., Piskunov, N., Kurucz, R. L., et al. 2015, Phys. Scr, 90, 054005 [Google Scholar]
- Skilling, J., & Bryan, R. K., 1984, MNRAS, 211, 111 [NASA ADS] [CrossRef] [Google Scholar]
- Sousa, A. P., Alencar, S. H. P., Bouvier, J., et al. 2016, A&A, 586, A47 [NASA ADS] [CrossRef] [EDP Sciences] [Google Scholar]
- Stassun, K. G., Oelkers, R. J., Pepper, J., et al. 2018, AJ, 156, 102 [Google Scholar]
- Suin, P., Arzoumanian, D., Zavagno, A., & Hennebelle, P., 2025, A&A, 698, A119 [NASA ADS] [CrossRef] [EDP Sciences] [Google Scholar]
- Yang, H., Johns-Krull, C. M., & Valenti, J. A., 2008, AJ, 136, 2286 [NASA ADS] [CrossRef] [Google Scholar]
- Zanni, C., & Ferreira, J., 2013, A&A, 550, A99 [NASA ADS] [CrossRef] [EDP Sciences] [Google Scholar]
Appendix A SPIRou observations: Additional material
Table A.1 provides the observation log for the SPIRou spectra of TWA 7 and the measurements derived from them at each epoch.
Appendix B Magnetic field and temperature changes: Additional material
Figure B.1 shows the Bℓ and d T curves with the corresponding GPR fits zooming in on the 2021 data.
Appendix C ZDI modeling: Additional material
Figure C.1 shows, for each epoch, the ZDI fits to the photometric curves derived from d T and the brightness maps derived simultaneously with the magnetic maps of Fig. 3.
Appendix D RV modeling: Additional material
Figure D.1 shows the RV curve and MCMC + GPR fit zooming in on the 2021 data. Fig. D.2 shows the periodogram of Fig. 5 (left panel) with frequencies on the x-axis.
Appendix E Activity: Additional material
Figure E.1 shows the EW of the differential He I spectra fitted with GPR and zooming in on the 2021 data.
Observing log of our SPIRou observations of TWA 7
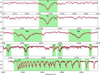 |
Fig. A.1 Small portion of our template SPIRou spectrum of TWA 7 in the K band (black circles), along with the optimal fit achieved with ZeeTurbo (red line) using the modeling approach of Cristofari et al. (2023). The green areas indicate spectral regions considered in the fit, and the dotted line shows the model with no magnetic field. |
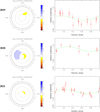 |
Fig. C.1 Brightness maps (left panels) reconstructed simultaneously with the magnetic maps of Fig. 3 with ZDI and photometric light curves inferred from d T estimates (red circles, right panels) with ZDI fits (green curves). In the maps, yellow and blue depict regions darker and brighter than the quiet photosphere, respectively. |
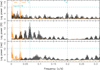 |
Fig. D.2 Same as the left panel of Fig. 5 but with frequencies (instead of periods) on the x-axis. The orange dashed and dotted vertical lines depict the one year frequency, Pyear, and the peak of the window function (at 32.0 d, with its one year aliases) roughly corresponding to the synodic frequency of the Moon, Pmoon. |
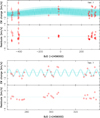 |
Fig. E.1 Same as Fig. 1 but for the EW of the differential He I spectra (top panel) and zooming in on the 2021 data (bottom panel), assuming θ3=250 d. The data point recorded when TWA 7 flared was removed from this analysis. |
All Tables
Results of the Markov Chain Monte Carlo modeling of the Bℓ (top) and d T (bottom) curves of TWA 7.
Properties of the large-scale and small-scale field for the magnetic topologies reconstructed with ZDI for all three seasons.
All Figures
|
Fig. 1 Longitudinal magnetic field Bℓ (top panel) and temperature variations d T (bottom panel) of TWA 7 (red dots) and the QP GPR fit to the data (cyan full line) with the corresponding 68% confidence intervals (cyan dotted lines). The residuals, shown in the bottom plot of each panel, yielded rms of 8.2 G and 2.9 K ( |
| In the text | |
|
Fig. 2 Observed (thick black line) and modeled (thin red line) LSD Stokes I (top row) and V (bottom row) profiles of TWA 7 for seasons 2019, 2020, and 2021 (from left to right). Rotation cycles (counting from 0, 71, and 147, for seasons 2019, 2020, and 2021, respectively, see Table A.1) are indicated to the right of the LSD profiles, and the ± 1 σ error bars are shown to the left of the Stokes V profiles. |
| In the text | |
|
Fig. 3 Reconstructed maps of the large-scale field of TWA 7 showing the radial, azimuthal and meridional components in spherical coordinates (left, middle and right columns, units in G) for season 2019, 2020, and 2021 (top to bottom rows, respectively). These maps, derived from the LSD Stokes IV profiles of Fig. 2 using ZDI, are displayed in a flattened polar projection down to latitude −13°; the north pole is at the center and the equator is depicted as a bold line. Outer ticks mark the phases of observations. Positive radial, azimuthal, and meridional fields point outward, counterclockwise, and poleward, respectively. |
| In the text | |
|
Fig. 4 Raw (top), filtered (middle), and residual (bottom) RVs of TWA 7 (red dots) over the observing period. The top plot shows the MCMC fit to the data, including a QP GPR modeling of the activity and a tentative planet on a 15.21-d circular orbit (cyan). The middle plot shows the tentative planet RV signature (cyan) once activity was filtered out. The rms of the residuals is 2.8 m s−1. A zoom in on the 2021 data is shown in Fig. D.1. |
| In the text | |
|
Fig. 5 Periodogram and stacked periodogram of the RV data. Left panel: periodogram of the raw (top), filtered (middle), and residual (bottom) RV data, including a tentative planet on a 15.21-d circular orbit in the MCMC modeling. Dashed vertical cyan lines trace the stellar rotation period and the orbital period of the tentative planet, while the dashed horizontal line indicates a 0.1% false-alarm probability (FAP, computed following Press et al. 1992) in the periodogram of the RV data. No significant signal remains in the residual RVs at the main stellar and tentative planet periods (and their aliases). The orange curve depicts the periodogram of the window function. A version of this plot with frequencies on the x-axis is also provided in Fig. D.2. Right panel: stacked periodogram of the filtered RVs as a function of the number of RV points included in the Fourier analysis, beginning from the first observation. The color scale indicates the logarithmic power in the periodogram. The vertical dashed line traces the orbital period of the tentative planet. |
| In the text | |
|
Fig. 6 Phase-folded filtered (top) and residual (bottom) RVs for the model with a tentative planet on a 15.21-d circular orbit. Red dots show the individual RV measurements with their error bars, while black stars indicate average RVs over eight even phase bins. As in Fig. 4, the dispersion of RV residuals is 2.8 m s−1. |
| In the text | |
|
Fig. 7 Stacked Stokes I profiles (top panel) and 2D periodogram (bottom panel) of the 1083.3-nm He I IRT in the stellar rest frame for the 2021 spectra of TWA 7. The dashed horizontal line traces Prot and the vertical dotted lines depict the velocities of the three components of the He I triplet. The color scale traces the logarithmic power in the periodogram. Only the main peaks (colored yellow to red and extending over at least several velocity bins) are likely to be significant. |
| In the text | |
|
Fig. A.1 Small portion of our template SPIRou spectrum of TWA 7 in the K band (black circles), along with the optimal fit achieved with ZeeTurbo (red line) using the modeling approach of Cristofari et al. (2023). The green areas indicate spectral regions considered in the fit, and the dotted line shows the model with no magnetic field. |
| In the text | |
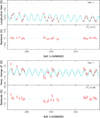 |
Fig. B.1 Same as Fig. 1 but zooming in on the 2021 data. |
| In the text | |
|
Fig. C.1 Brightness maps (left panels) reconstructed simultaneously with the magnetic maps of Fig. 3 with ZDI and photometric light curves inferred from d T estimates (red circles, right panels) with ZDI fits (green curves). In the maps, yellow and blue depict regions darker and brighter than the quiet photosphere, respectively. |
| In the text | |
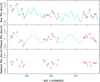 |
Fig. D.1 Same as Fig. 4 but zooming in on the 2021 data |
| In the text | |
|
Fig. D.2 Same as the left panel of Fig. 5 but with frequencies (instead of periods) on the x-axis. The orange dashed and dotted vertical lines depict the one year frequency, Pyear, and the peak of the window function (at 32.0 d, with its one year aliases) roughly corresponding to the synodic frequency of the Moon, Pmoon. |
| In the text | |
|
Fig. E.1 Same as Fig. 1 but for the EW of the differential He I spectra (top panel) and zooming in on the 2021 data (bottom panel), assuming θ3=250 d. The data point recorded when TWA 7 flared was removed from this analysis. |
| In the text | |
Current usage metrics show cumulative count of Article Views (full-text article views including HTML views, PDF and ePub downloads, according to the available data) and Abstracts Views on Vision4Press platform.
Data correspond to usage on the plateform after 2015. The current usage metrics is available 48-96 hours after online publication and is updated daily on week days.
Initial download of the metrics may take a while.