Fig. 3
Download original image
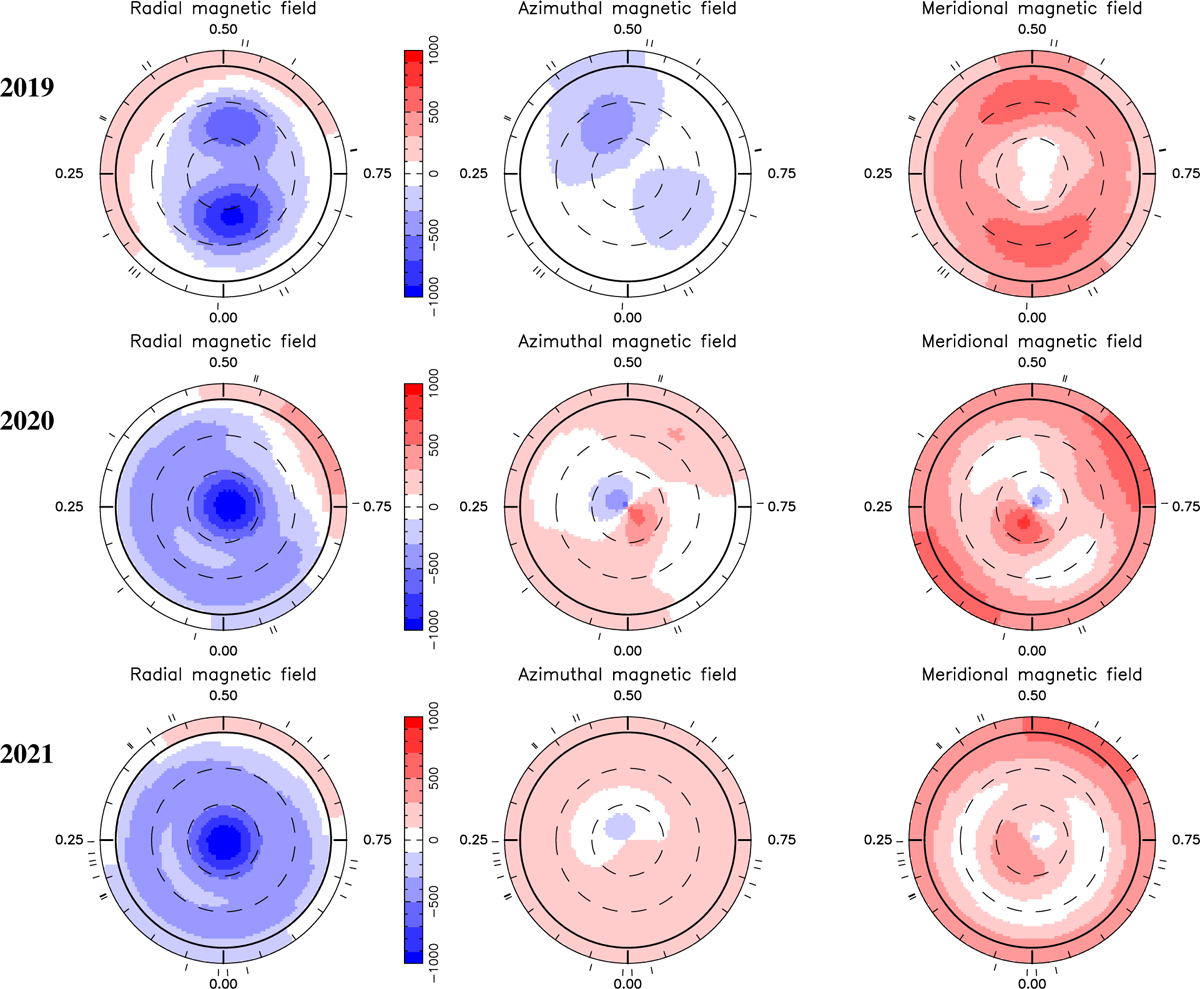
Reconstructed maps of the large-scale field of TWA 7 showing the radial, azimuthal and meridional components in spherical coordinates (left, middle and right columns, units in G) for season 2019, 2020, and 2021 (top to bottom rows, respectively). These maps, derived from the LSD Stokes IV profiles of Fig. 2 using ZDI, are displayed in a flattened polar projection down to latitude −13°; the north pole is at the center and the equator is depicted as a bold line. Outer ticks mark the phases of observations. Positive radial, azimuthal, and meridional fields point outward, counterclockwise, and poleward, respectively.
Current usage metrics show cumulative count of Article Views (full-text article views including HTML views, PDF and ePub downloads, according to the available data) and Abstracts Views on Vision4Press platform.
Data correspond to usage on the plateform after 2015. The current usage metrics is available 48-96 hours after online publication and is updated daily on week days.
Initial download of the metrics may take a while.