Fig. 5
Download original image
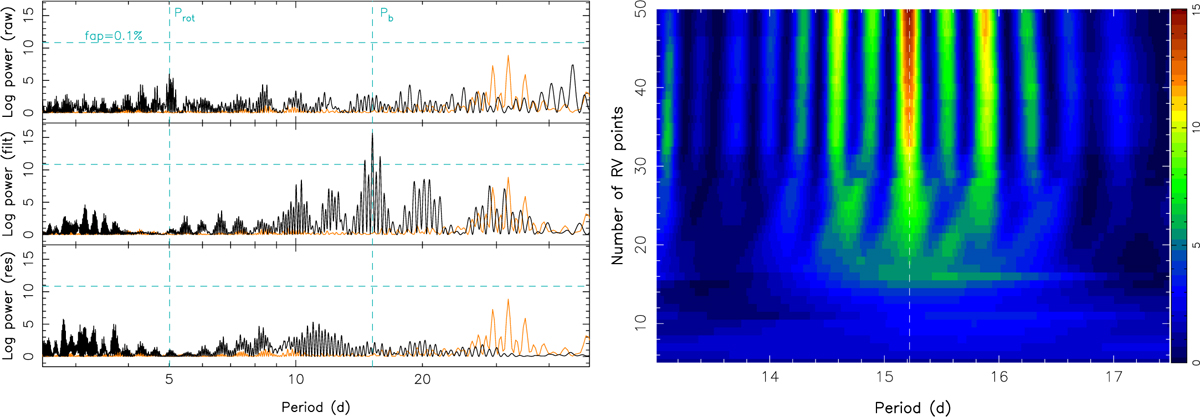
Periodogram and stacked periodogram of the RV data. Left panel: periodogram of the raw (top), filtered (middle), and residual (bottom) RV data, including a tentative planet on a 15.21-d circular orbit in the MCMC modeling. Dashed vertical cyan lines trace the stellar rotation period and the orbital period of the tentative planet, while the dashed horizontal line indicates a 0.1% false-alarm probability (FAP, computed following Press et al. 1992) in the periodogram of the RV data. No significant signal remains in the residual RVs at the main stellar and tentative planet periods (and their aliases). The orange curve depicts the periodogram of the window function. A version of this plot with frequencies on the x-axis is also provided in Fig. D.2. Right panel: stacked periodogram of the filtered RVs as a function of the number of RV points included in the Fourier analysis, beginning from the first observation. The color scale indicates the logarithmic power in the periodogram. The vertical dashed line traces the orbital period of the tentative planet.
Current usage metrics show cumulative count of Article Views (full-text article views including HTML views, PDF and ePub downloads, according to the available data) and Abstracts Views on Vision4Press platform.
Data correspond to usage on the plateform after 2015. The current usage metrics is available 48-96 hours after online publication and is updated daily on week days.
Initial download of the metrics may take a while.