| Issue |
A&A
Volume 704, December 2025
|
|
|---|---|---|
| Article Number | L17 | |
| Number of page(s) | 4 | |
| Section | Letters to the Editor | |
| DOI | https://doi.org/10.1051/0004-6361/202557328 | |
| Published online | 15 December 2025 | |
Letter to the Editor
Variation in the disk thickness across ice bands: A method for determining ice abundances in highly inclined protoplanetary disks
1
Univ. Grenoble Alpes, CNRS, IPAG, 38000 Grenoble, France
2
Astronomy Department, University of California Berkeley, Berkeley, CA 94720-3411, USA
3
Jet Propulsion Laboratory, California Institute of Technology, Mail Stop 321-100, 4800 Oak Grove Drive, Pasadena, CA 91109, USA
4
Department of Earth Science and Astronomy, The University of Tokyo, Tokyo 153-8902, Japan
5
Department of Chemistry, University of California Berkeley, Berkeley, CA 94720, USA
6
Institut des Sciences Moléculaires d’Orsay, CNRS, Univ. Paris-Saclay, Orsay, France
7
CNRS, Aix-Marseille Université, Laboratoire PIIM, Marseille, France
★ Corresponding author This email address is being protected from spambots. You need JavaScript enabled to view it.
Received:
19
September
2025
Accepted:
30
November
2025
Abstract
Context. The James Webb Space Telescope provides unprecedented information about ices in protoplanetary disks. However, the saturation of ice bands in highly inclined disks hinders the measurement of ice abundances via classical spectroscopy. This is unfortunate as the presence and, more importantly, the abundance of ices play a key role in, for example, the evolution of dust (because it modifies the sticking properties) and the composition of planetesimals and exoplanetary atmospheres.
Aims. To overcome this issue and quantify the ice abundance within disks, we introduce a new method based on measuring the changes in the apparent disk thickness as a function of wavelength, which is directly and quantitatively related to the grain opacity. Specifically, we expect (i) that the increased opacity within ice bands results in a thicker disk than in the adjacent continuum, and (ii) the thickness variations to be proportional to the abundance of ice.
Methods. We extracted the disk thickness from model images of edge-on disks containing different abundances of water ice as well as from James Webb Space Telescope spectral imaging of four edge-on disks.
Results. For both models and observations, the disk thickness decreases toward longer wavelengths except at the positions of ice absorption features, where the thickness is greater across the band. In the model images, we demonstrate that this effect increases with ice abundance without any hint of saturation. This demonstrates that ice species are present within each disk and confirms our expectation that this method can be applied to estimate ice abundances.
Conclusions. Thanks to this method, it will thus be possible to constrain the abundance of ice in highly inclined disks with disk model fitting. Unlike spectroscopic analyses, this method is not subject to saturation and should therefore be more robust and applicable to all disks for which the two surfaces can be resolved.
Key words: protoplanetary disks / stars: variables: T Tauri / Herbig Ae/Be
© The Authors 2025
 Open Access article, published by EDP Sciences, under the terms of the Creative Commons Attribution License (https://creativecommons.org/licenses/by/4.0), which permits unrestricted use, distribution, and reproduction in any medium, provided the original work is properly cited.
This article is published in open access under the Subscribe to Open model. This email address is being protected from spambots. You need JavaScript enabled to view it. to support open access publication.
1. Introduction
Ices are assumed to be ubiquitous in protoplanetary disks and to play a key role in planetary formation (Boogert et al. 2015; Pontoppidan et al. 2014; Musiolik & Wurm 2019; McClure et al. 2023). The shape and minimum position of ice bands can provide information on ice properties. However, investigating ice features is challenging and requires particular caution. Several studies have shown that these features depend on the system geometry as well as on the path of photons and the relative contributions of absorption and scattering (Pontoppidan et al. 2005; Sturm et al. 2023; Dartois et al. 2022; Martinien et al. 2024, 2025). Martinien et al. (2025) used model images to demonstrate that, for sufficiently inclined disks, ice features also depend on the location within the disk: band shapes are completely different at the edges (scattering-dominated light) compared to the central point source (transmitted light). The James Webb Space Telescope (JWST) now enables new insights into ices through spectrophotometry and will help us study ice behaviors in more detail.
However, it is unclear how one can determine ice abundances within the disk. The most common ice bands reach saturation in highly inclined disks due to radiative transfer effects, especially multiple scattering. This phenomenon of band saturation has been observed in several models with integrated spectra: in the edge-on disk HH 48 NE (Sturm et al. 2023) and in the grazing-angle disk PDS 453 (Martinien et al. 2024), but also in generic models with spectra extracted at different locations within the disk (Martinien et al. 2025).
Fortunately, the geometry of highly inclined disks allows their vertical structure to be probed and the thickness of the disk to be measured. Observationally, these disks present a unique shape, with their two scattering nebulae separated by a central dark lane. The thickness of the disk across the absorption band, measured as the separation between the maxima of the two scattering nebulae, can be used to overcome the problem of band saturation. This separation is directly connected to the disk mass and dust opacity (Watson & Stapelfeldt 2004). Therefore, measuring the disk thickness as a function of wavelength is a direct, quantitative probe of the opacity law of the solid particles in the disk. Thus, changes can appear in the distance between the two nebulae because of the addition of ice opacity over continuum opacity. This can be directly linked to the abundance of ice within the disk and, when coupled with disk modeling, can serve as a tracer of ice abundance.
The best objects for studying this are thus edge-on disks for which the two scattering nebulae are well separated. We studied two edge-on disks in Taurus (Tau 042021 and HH 30) and two in Ophiuchus (Oph 163131 and Flying Saucer); all are T Tauri stars. For the first three disks, JWST/NIRCam (Near Infrared Camera) images were analyzed by Duchêne et al. (2024), Tazaki et al. (2025), and Villenave et al. (2024), respectively, who notably measured the distance between the two nebulae. The presence of multiple ice species has been demonstrated in HH 30, Tau 042021 (Pascucci et al. 2025; Dartois et al. 2025), and Flying Saucer (Aikawa et al. 2012).
In this Letter we first use synthetic model images to demonstrate that the presence of water ice in a disk can be inferred from the disk thickness and that the effect does not saturate, even with high ice abundances. We then show that this phenomenon is observed in all four edge-on disks studied here. Finally, we propose a method for estimating the ice abundance in highly inclined disks, independent of spectroscopic analysis.
2. Modeling setup and JWST data
We measured the disk thickness in models and observations of edge-on disks to monitor its variations as a function of wavelength. In this study we defined the disk thickness as the distance between the two scattering nebulae (dneb) at the position for which the dark lane is narrowest; see Fig. 1.
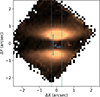 |
Fig. 1. JWST/NIRSpec image of Tau 042021 centered at 3.1 μm with a binning of 30 slices (0.01 μm). The solid blue line represents the distance between the two nebulae, and the dotted blue lines represent the limits over which we measured this distance. |
We studied the disk thickness between 2.0 and 4.0 μm in the edge-on disk model described in Martinien et al. (2025), which contains 70% astronomical silicates and 30% water ice in volume fraction. We used the radiative transfer code MCFOST (Pinte et al. 2006) to vary the water-ice abundance in the disk by considering different volume fractions ranging from 0% to 90%, sampled every 15%. Following the study of Martinien et al. (2025), we considered only water ice; however, we expect the same phenomenon to be present in other ice species (CO2 and CO) because the behavior of their opacity constants is similar to that of water ice. We applied a convolution by a wavelength-scaled Gaussian kernel as a simple approximation of the JWST point spread function.
We also used JWST/NIRSpec integral field unit archival data of Cycle 1 (program number: 1621, PI: I. Pascucci) and Cycle 3 (program number: 5299, PI: J. Bergner) with calibration software version 1.18.0 to study the disk thickness in observations. In most cases, the two surface nebulae are well separated. However, Oph 163131 is much thinner and the distance between the nebulae is more difficult to estimate, especially at the longest wavelengths. We used three filters with three grisms for HH 30 and Tau 042021: G140H, G235H, and G395H, which provide a wavelength coverage between 0.97 and 5.27 μm. For Flying Saucer and Oph 163131, we used two filters with two grisms: G235H and G395H, which provide a wavelength coverage between 1.66 and 5.27 μm. We removed the bad slices for which the disk was cut and applied a binning of 20 slices except for Tau 042021, for which we binned over 30 slices along the spectral dimension to reduce the noise. Despite the NIRSpec pixel scale of 0.1″, the achieved S/N is sufficient to enable a precise measurement of the distance between the two nebulae. This results in an effective sampling that is about 10 times lower than the instrument resolution, ensuring that all points are independent.
We first extracted the vertical profile at the central pixel of the disk for the model images as well as observations of HH 30 and Oph 163131. However, for Tau 042021 and Flying Saucer, whose images had a lower S/N, we integrated over 0.6″ and 0.4″, respectively, around the central pixel. We then used Gaussian fits to the brightness profile to find the position of the peaks of each nebula. We note that the brightness profile is not exactly Gaussian and that using different peak-finding methods can yield slightly different disk thicknesses, but the general trend and spectral features remain unchanged. In most cases, we performed the fit one nebula at a time as they are well separated in the images. However, for the thin disk Oph 163131, the lack of a clear separation between the two nebulae required the use of a simultaneous double Gaussian fit, as no distinct second peak could be identified. Even then, the results have to be considered with caution at longer wavelengths: beyond 4 μm, the separation is so thin that the Gaussian fit is biased and the estimated distance appears to rise, in contradiction with the results from the better-sampled NIRCam images (Villenave et al. 2024).
3. Results
3.1. Disk thickness in models
Figure 2 (left panel) shows the distance between the two nebulae in the edge-on disk model at 90° in Martinien et al. (2025) for different water-ice abundances. For each abundance, dneb decreases with wavelength because of the decreasing continuum dust opacity. However, dneb increases with a feature (or bump) around ∼3.1 μm, which corresponds to the position of the water-ice band. We defined the height of the bump relative to the continuum, Δdneb/dneb, with dneb determined at the wavelength of the peak. We can clearly see that this height is correlated with the ice abundance and is not subject to saturation, as demonstrated by the nearly linear relationship shown in the right panel of Fig. 2. When there is no water ice in the model, the distance monotonically decreases with wavelength without any bump. However, an increase in the ice abundance leads to a more prominent change in thickness across the 3 μm ice band.
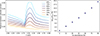 |
Fig. 2. Left: Distance between the two nebulae as a function of wavelength in the edge-on disk model presented in Martinien et al. (2025) for different water-ice abundances. Right: Bump heights relative to the continuum in the same models as a function of ice abundance. |
The shape of the bump also changes with the ice abundance, with a more roundish shape for low abundances and a sharper bump for high abundances. The continuum on both sides of the water-ice feature, especially at longer wavelengths, is higher with the addition of water ice. This results from an increase in the extinction and scattering opacity at higher ice abundances, as ice-dominated grains scatter more efficiently. We emphasize that the proportionality between ice abundance and Δdneb/dneb is model-dependent and will vary with parameters such as system inclination, disk mass, and scale height. In particular, a larger scale height will amplify the increase in disk thickness with ice abundance, while a smaller scale height will diminish this effect.
3.2. Disk thickness in observations
The same phenomenon is observed in JWST/NIRSpec observations of HH 30, Tau 042021, Flying Saucer, and Oph 163131 (Fig. 3). The dneb decreases with wavelength due to the reduced dust opacity except around ∼3.1 μm, where the dneb increases due to the addition of opacity from water ice. The shift is subtle in the images, about half a pixel, but is easily measurable given the high S/N of the data, as illustrated by the smoothness of the resulting plots in Fig. 3. The resulting errors can be determined as the scatter along the curves, are the product of the S/N and the thickness of the dark lane, and, thus, depend on each object. We note that the offset between the absolute values of our distance measurements and those from the JWST/NIRCam archival data presented in Fig. 3 arises from a combination of the difference in spatial sampling between NIRCam and NIRSpec and the use of different measurement methods. Crucially, these effects do not impact the overall trend.
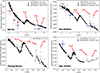 |
Fig. 3. Distance between the two nebulae as a function of wavelength in JWST/NIRSpec observations. In Oph 163131, the gray points correspond to a wavelength range in which the two nebulae are no longer clearly separated and the results of the Gaussian fit are likely biased upward. The horizontal bars correspond to the wavelength coverage of each imaging filter. |
Furthermore, there are also bumps for all disks around ∼4.2 and ∼4.6 μm, corresponding to CO2 and CO ices, respectively. To go beyond spectroscopic analyses, our study unambiguously demonstrates that the ices are located inside the disks themselves and not from the foreground absorption, as the latter would not affect the apparent disk morphology.
Moreover, the ratios of Δdneb/dneb for H2O, CO2, and CO ices differ among the four disks, suggesting different relative abundances of these ice species. Finally, we note that the amplitude of the bumps is not correlated with the depth of the same ice bands measured in the spectra presented in Aikawa et al. (2012) and Pascucci et al. (2025).
4. Discussion and conclusions
The bumps present in models and observations are caused by an increase in opacity due to the presence of ices on top of the continuum opacity, raising the height of the scattering surface at the center of the bands. The bump height is clearly correlated with the ice abundance within the disks (Fig. 2). However, the ice location and abundance depend on the temperature structure as well as the chemistry (Woitke et al. 2022). Therefore, we refrain from attributing an ice abundance to a bump height or comparing ice abundances of different disks. Within a given disk, if we assume that the ratio of bump heights traces the abundance ratio, then the different Δdneb/dneb measured in the various disks suggest variations in relative species abundances. If this is true, it will be possible to speculate about the relative ice abundances of H2O, CO2, and CO within each disk by looking at bump heights relative to the continuum; we estimated the values of the continuum via linear interpolation from either side of the band (see Table 1). There is a variety of ice compositions in the disk sample. HH 30 is dominated by the H2O feature, Tau 042021 exhibits stronger CO2 and CO signatures, and Flying Saucer and Oph 163131 display more balanced contributions from the three ice species. These differences can be driven by sublimation effects due to differences in disk size, star properties, or environment, and therefore, quantitative ice absolute abundance estimates will require physico-chemical models tailored to each source.
Bump heights relative to the continuum (Δdneb/dneb) of the three ice species for the four edge-on disks.
There are also differences in bump widths between different ice species. This is linked to the difference of band widths in spectra. The CO2 and CO bumps are narrower than the H2O bump. This can be explained by the wavelength coverage of the H2O ice band, which is wider (Gibb et al. 2004) than the wavelength coverage of CO2 and CO ice bands because of their refractive index. Moreover, as shown in Sect. 3, the shape of the water-ice bump is more roundish for low abundances and sharper for high abundances (Fig. 2). Hence, the bump shape itself may provide additional insight into ice abundances.
In more detail, the method consists of building a model for which the disk thickness, and thus the opacities, is in agreement with the observed thickness, and then considering the ice abundance as the only tunable parameter to match the observed bump height. The method is not restricted to edge-on disks; it can also be applied to less inclined disks such as those seen at grazing angles, as long as the geometry allows both scattering nebulae to be observed. For instance, we applied the same method in our model with a grazing-angle inclination and observed the same trend.
Thanks to measurements of the disk thickness in highly inclined disks, it will thus be possible to determine the abundance of ices by fitting specific disk models. The only caveat is that, in order to obtain reliable measurements at all wavelengths, the distance between the two nebulae must be visible, which requires the disk surfaces to be well separated. This limitation is exemplified by the case of Oph 163131. As our models demonstrate, this method is not affected by the saturation problem inherent to spectroscopic studies, and it thus promises to be more robust and broadly applicable.
Acknowledgments
This project has received funding from the European Research Council (ERC) under the European Union’s Horizon Europe research and innovation program (grant agreement No. 101053020, project Dust2Planets, PI: F. Ménard). E.D. and J.A.N. acknowledge support from the Thematic Action ‘Physique et Chimie du Milieu Interstellaire’ (PCMI) of INSU Programme National ‘Astro’, with contributions from CNRS Physique & CNRS Chimie, CEA, and CNES. The data presented in this paper were obtained from the Mikulski Archive for Space Telescopes (MAST) at the Space Telescope Science Institute. The JWST observations analyzed can be accessed via https://doi.org/10.17909/4tha-mz43.
References
- Aikawa, Y., Kamuro, D., Sakon, I., et al. 2012, A&A, 538, A57 [NASA ADS] [CrossRef] [EDP Sciences] [Google Scholar]
- Boogert, A. C. A., Gerakines, P. A., & Whittet, D. C. B. 2015, ARA&A, 53, 541 [Google Scholar]
- Dartois, E., Noble, J. A., Ysard, N., Demyk, K., & Chabot, M. 2022, A&A, 666, A153 [NASA ADS] [CrossRef] [EDP Sciences] [Google Scholar]
- Dartois, E., Noble, J. A., McClure, M. K., et al. 2025, A&A, 698, A8 [NASA ADS] [CrossRef] [EDP Sciences] [Google Scholar]
- Duchêne, G., Ménard, F., Stapelfeldt, K. R., et al. 2024, AJ, 167, 77 [CrossRef] [Google Scholar]
- Gibb, E. L., Whittet, D. C. B., Boogert, A. C. A., & Tielens, A. G. G. M. 2004, ApJS, 151, 35 [NASA ADS] [CrossRef] [Google Scholar]
- Martinien, L., Ménard, F., Duchêne, G., et al. 2024, A&A, 692, A111 [NASA ADS] [CrossRef] [EDP Sciences] [Google Scholar]
- Martinien, L., Duchêne, G., Ménard, F., Tazaki, R., & Stapelfeldt, K. R. 2025, A&A, 696, L6 [NASA ADS] [CrossRef] [EDP Sciences] [Google Scholar]
- McClure, M. K., Rocha, W. R. M., Pontoppidan, K. M., et al. 2023, Nat. Astron., 7, 431 [NASA ADS] [CrossRef] [Google Scholar]
- Musiolik, G., & Wurm, G. 2019, ApJ, 873, 58 [NASA ADS] [CrossRef] [Google Scholar]
- Pascucci, I., Beck, T. L., Cabrit, S., et al. 2025, Nat. Astron., 9, 81 [Google Scholar]
- Pinte, C., Ménard, F., Duchêne, G., & Bastien, P. 2006, A&A, 459, 797 [NASA ADS] [CrossRef] [EDP Sciences] [Google Scholar]
- Pontoppidan, K. M., Dullemond, C. P., van Dishoeck, E. F., et al. 2005, ApJ, 622, 463 [NASA ADS] [CrossRef] [Google Scholar]
- Pontoppidan, K. M., Salyk, C., Bergin, E. A., et al. 2014, in Protostars and Planets VI, eds. H. Beuther, R. S. Klessen, C. P. Dullemond, & T. Henning, 363 [Google Scholar]
- Sturm, J. A., McClure, M. K., Bergner, J. B., et al. 2023, A&A, 677, A18 [NASA ADS] [CrossRef] [EDP Sciences] [Google Scholar]
- Tazaki, R., Ménard, F., Duchêne, G., et al. 2025, ApJ, 980, 49 [Google Scholar]
- Villenave, M., Stapelfeldt, K. R., Duchêne, G., et al. 2024, ApJ, 975, 235 [Google Scholar]
- Watson, A. M., & Stapelfeldt, K. R. 2004, ApJ, 602, 860 [Google Scholar]
- Woitke, P., Arabhavi, A. M., Kamp, I., & Thi, W. F. 2022, A&A, 668, A164 [NASA ADS] [CrossRef] [EDP Sciences] [Google Scholar]
All Tables
Bump heights relative to the continuum (Δdneb/dneb) of the three ice species for the four edge-on disks.
All Figures
|
Fig. 1. JWST/NIRSpec image of Tau 042021 centered at 3.1 μm with a binning of 30 slices (0.01 μm). The solid blue line represents the distance between the two nebulae, and the dotted blue lines represent the limits over which we measured this distance. |
| In the text | |
|
Fig. 2. Left: Distance between the two nebulae as a function of wavelength in the edge-on disk model presented in Martinien et al. (2025) for different water-ice abundances. Right: Bump heights relative to the continuum in the same models as a function of ice abundance. |
| In the text | |
|
Fig. 3. Distance between the two nebulae as a function of wavelength in JWST/NIRSpec observations. In Oph 163131, the gray points correspond to a wavelength range in which the two nebulae are no longer clearly separated and the results of the Gaussian fit are likely biased upward. The horizontal bars correspond to the wavelength coverage of each imaging filter. |
| In the text | |
Current usage metrics show cumulative count of Article Views (full-text article views including HTML views, PDF and ePub downloads, according to the available data) and Abstracts Views on Vision4Press platform.
Data correspond to usage on the plateform after 2015. The current usage metrics is available 48-96 hours after online publication and is updated daily on week days.
Initial download of the metrics may take a while.