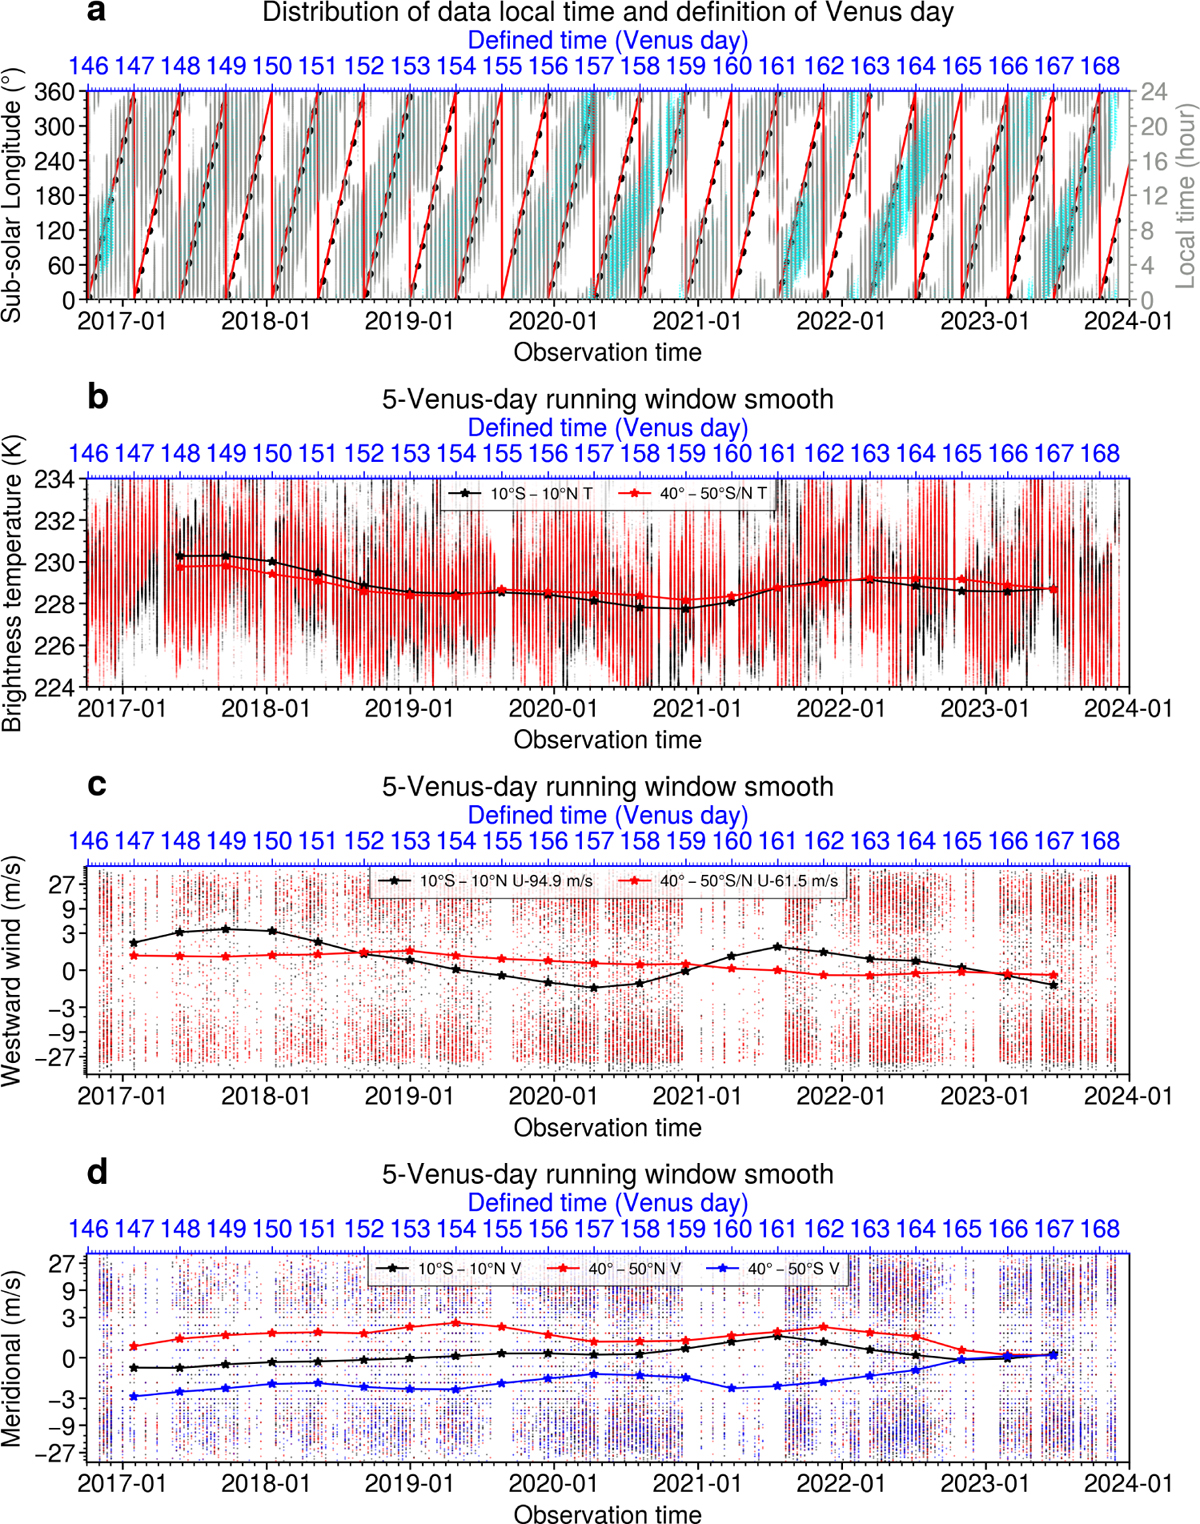
Fig. 1
Download original image
Distribution and smoothing of Akatsuki/LIR data. Panel a : distribution of brightness temperature (gray dots) and derived cloud-tracked winds (cyan dots) as a function of local time and observation date. Black dots indicate the subsolar longitude of each image. The defined Venus date was derived by fitting a sawtooth function to the subsolar longitude. Panels b-d: 1/12 Venus-day means of brightness temperature (b), zonal wind (c), and meridional wind (d). The solid lines represent 5-Venus-day running means applied to each variable.
Current usage metrics show cumulative count of Article Views (full-text article views including HTML views, PDF and ePub downloads, according to the available data) and Abstracts Views on Vision4Press platform.
Data correspond to usage on the plateform after 2015. The current usage metrics is available 48-96 hours after online publication and is updated daily on week days.
Initial download of the metrics may take a while.