Open Access
Fig. B.1
Download original image
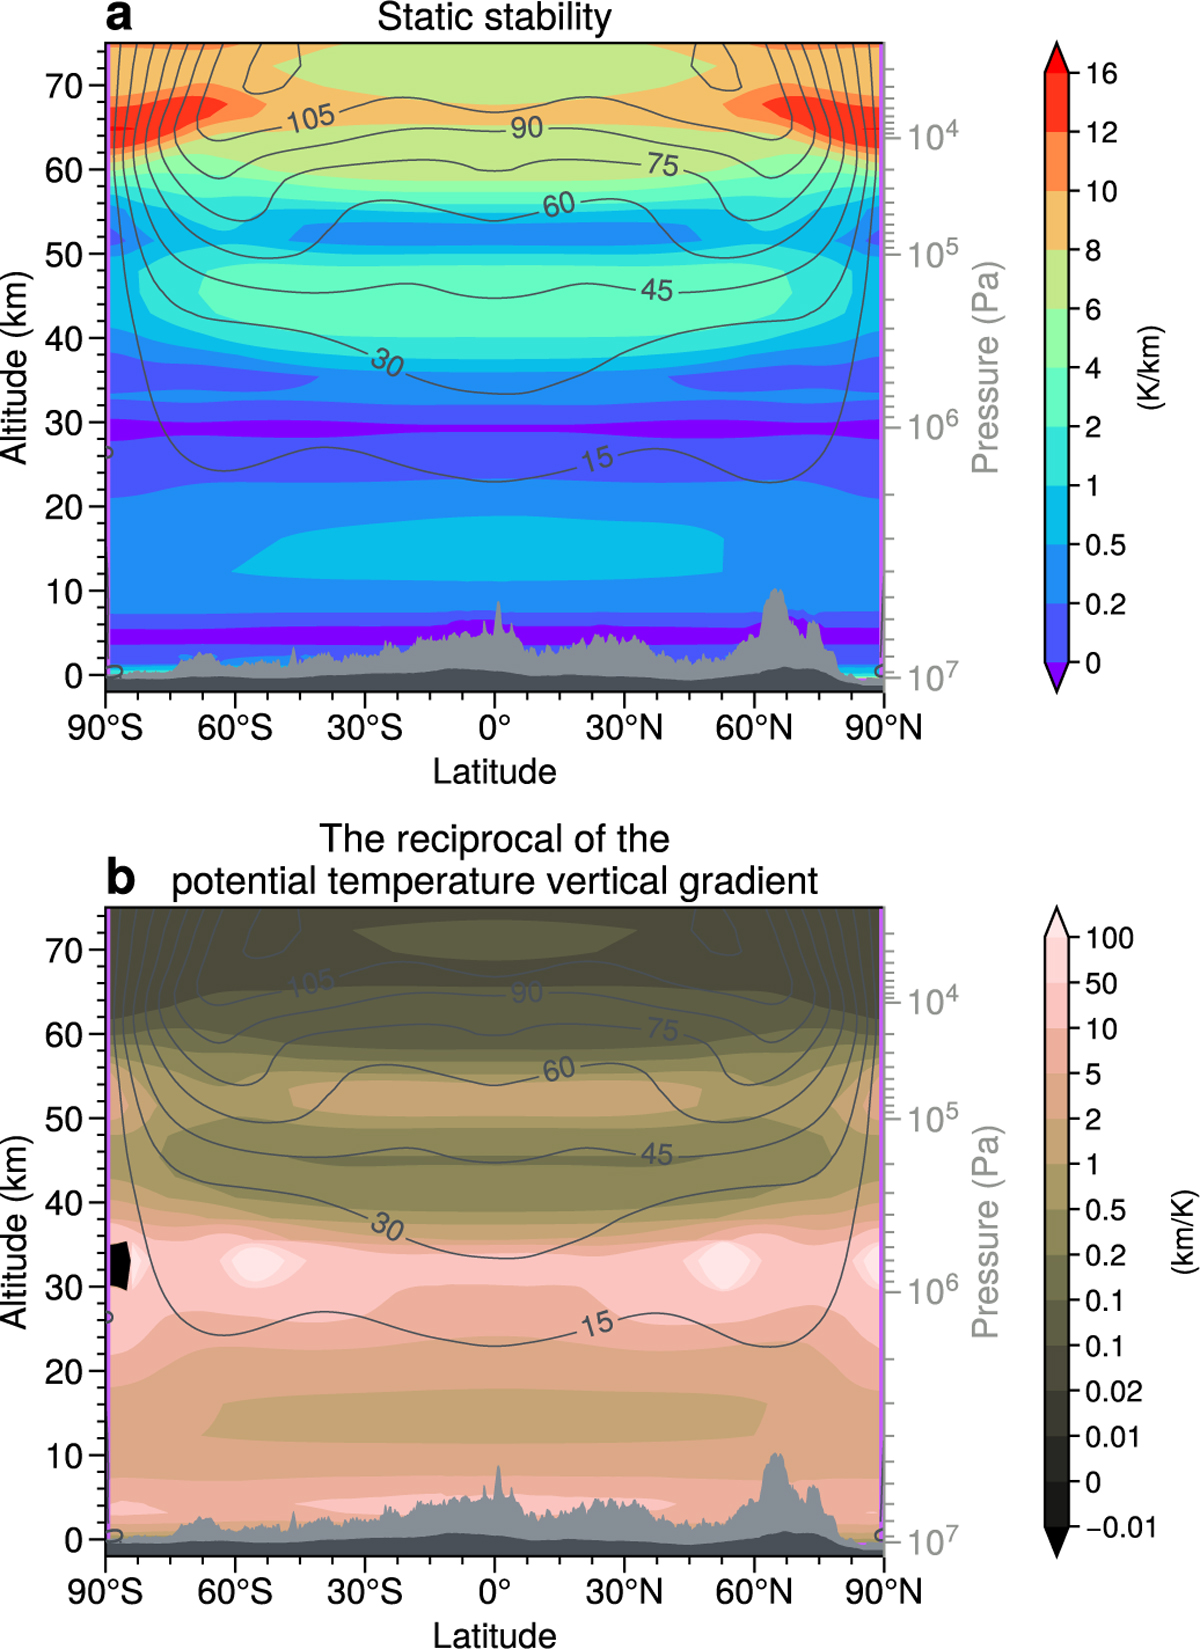
Temporal and zonal averaged static stability (a) and reciprocal of potential temperature vertical gradient (1/θ̄z, b) in the Venus PCM. Light and dark gray shading indicates, respectively, the maximum and mean surface topography at each latitude. Black contours represent the background zonal wind.
Current usage metrics show cumulative count of Article Views (full-text article views including HTML views, PDF and ePub downloads, according to the available data) and Abstracts Views on Vision4Press platform.
Data correspond to usage on the plateform after 2015. The current usage metrics is available 48-96 hours after online publication and is updated daily on week days.
Initial download of the metrics may take a while.