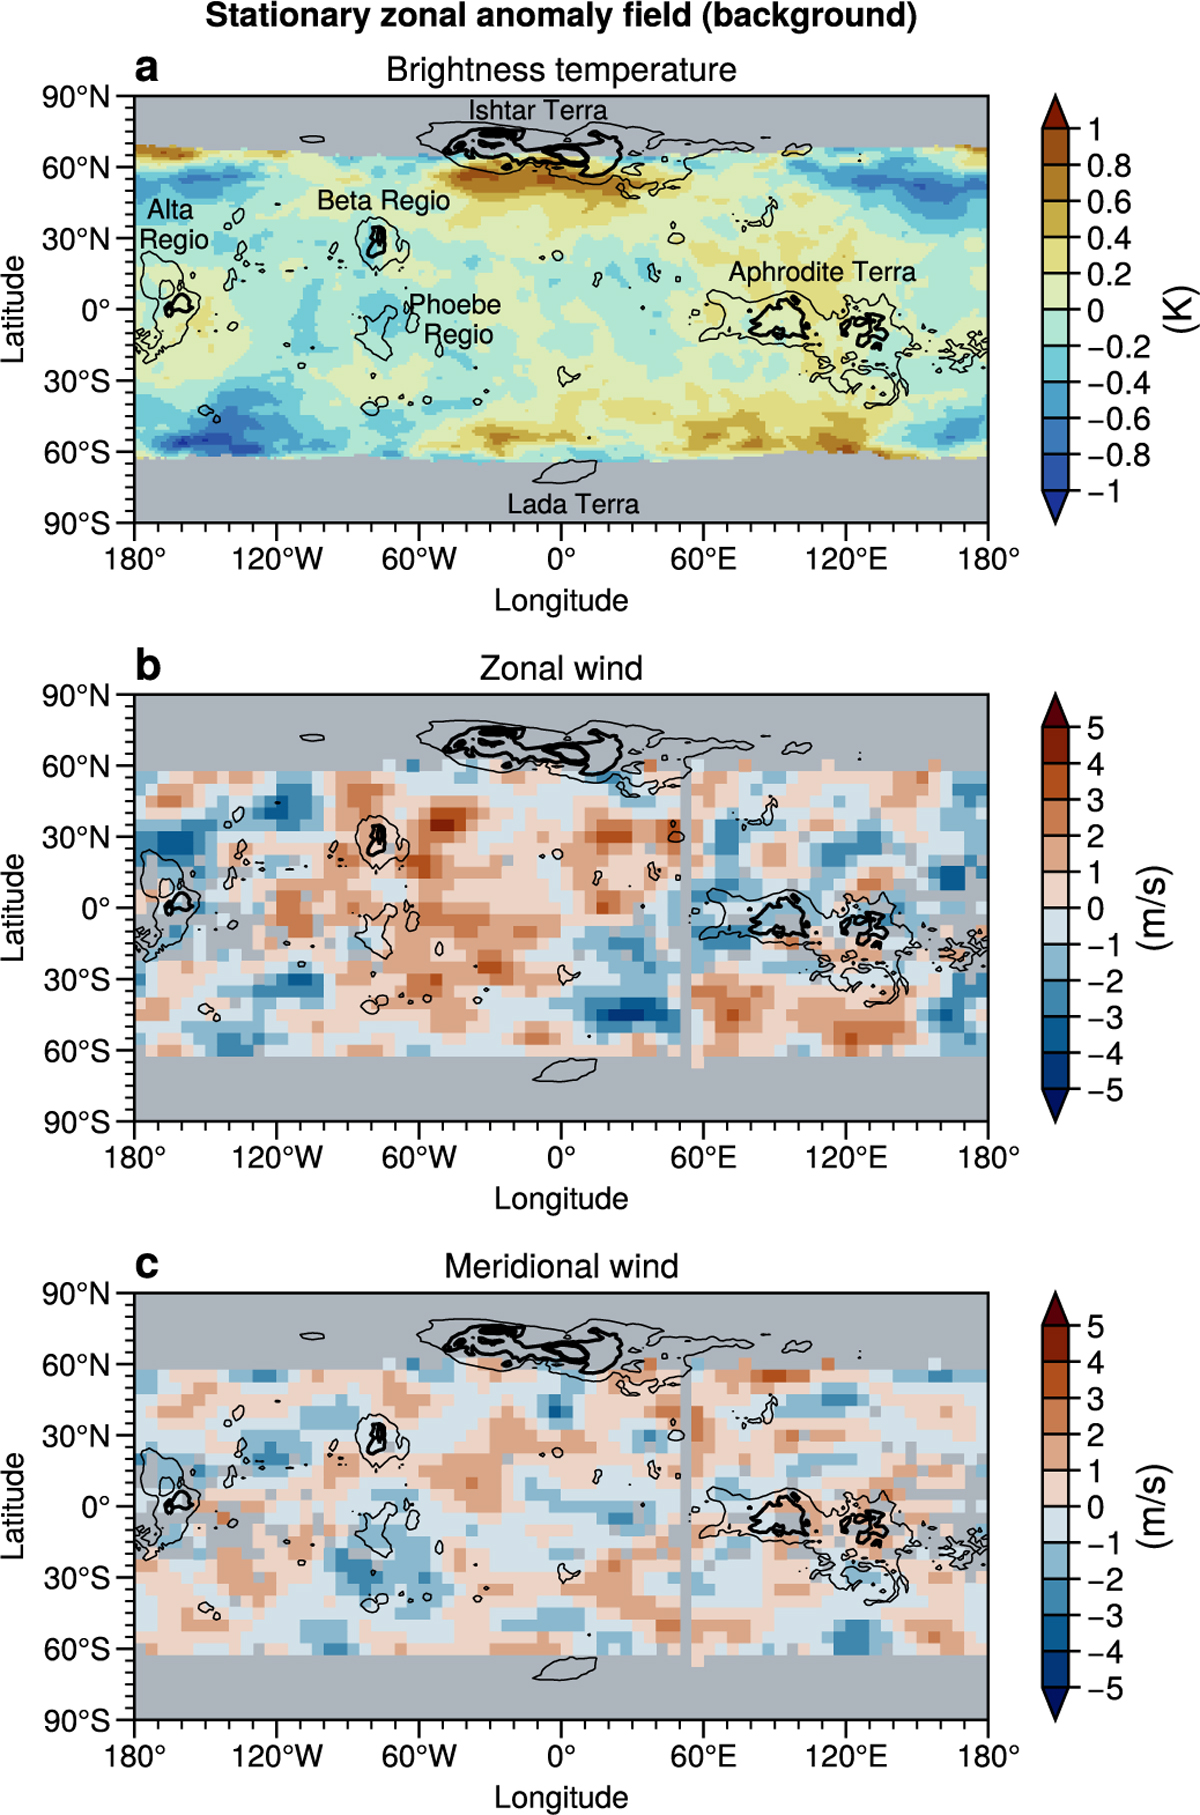
Fig. 2
Download original image
Zonal anomalies of stationary features observed by Akat-suki/LIR. Panels show brightness the temperature (a), zonal wind (b), and meridional wind (c) after a temporal median is applied following thermal tide removal. Color shading indicates zonal anomalies relative to the longitudinal mean at each latitude. Black contours indicate the surface topography at elevations of 1, 3, and 5 km, with major highland regions labeled in panel a. Gray areas indicate regions with insufficient valid data. For the wind (brightness temperature) data, areas left with fewer than 20 (40) valid measurements after the removal of thermal tides are left empty (see Fig. A.1a).
Current usage metrics show cumulative count of Article Views (full-text article views including HTML views, PDF and ePub downloads, according to the available data) and Abstracts Views on Vision4Press platform.
Data correspond to usage on the plateform after 2015. The current usage metrics is available 48-96 hours after online publication and is updated daily on week days.
Initial download of the metrics may take a while.