Fig. 5
Download original image
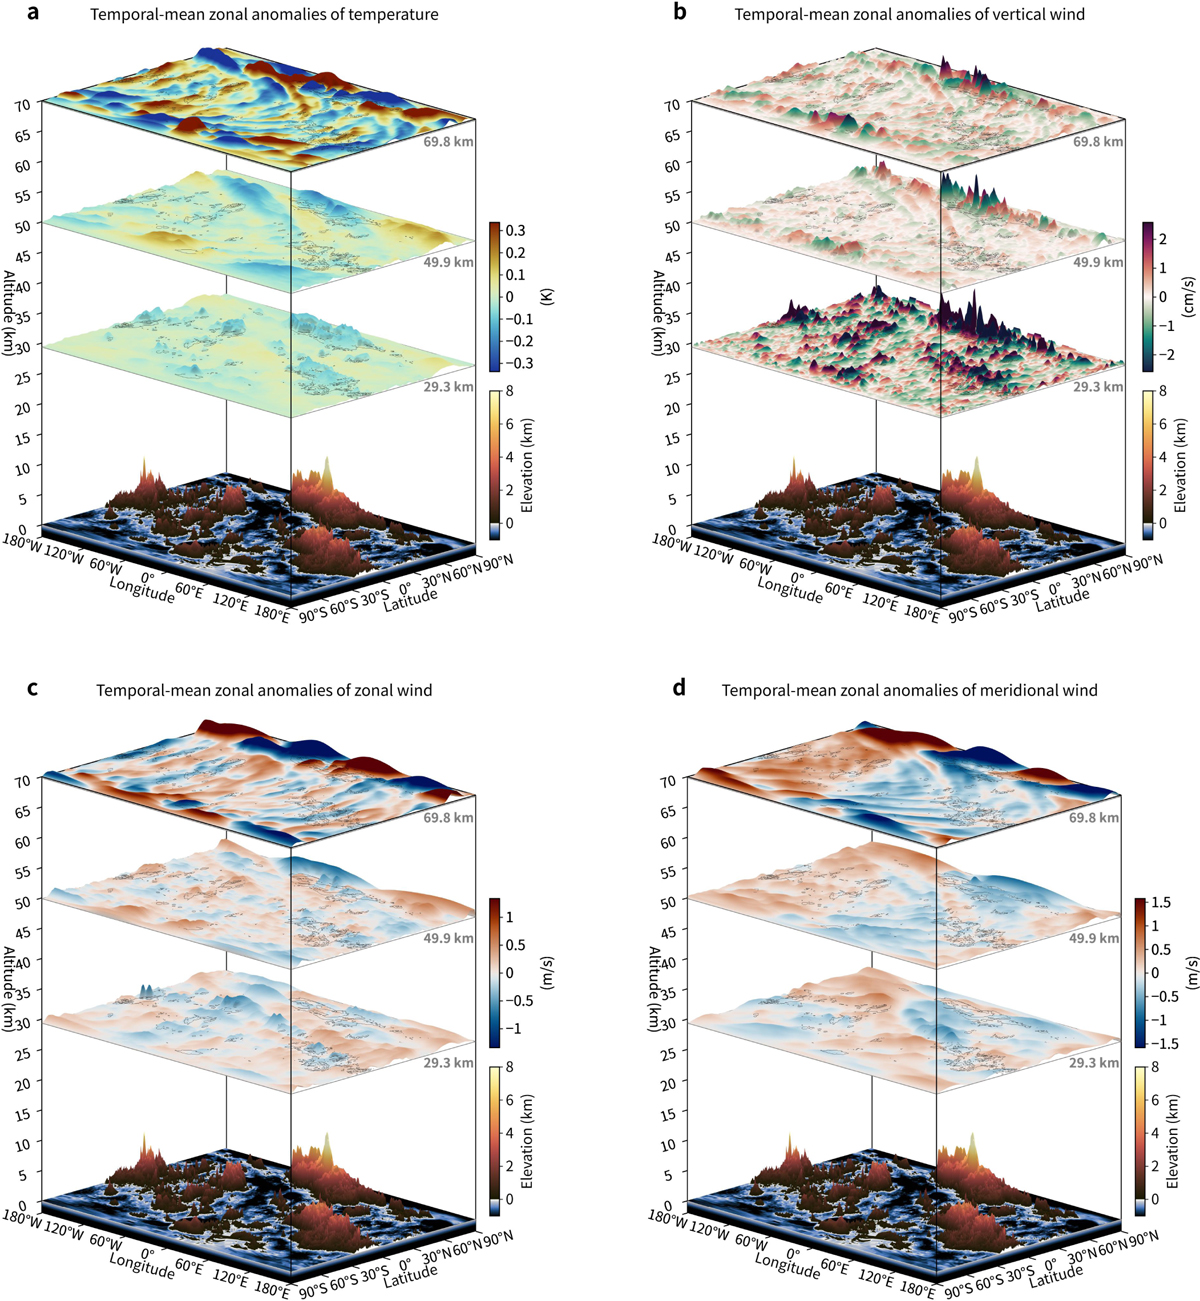
Horizontal structure of stationary waves simulated by the Venus PCM, averaged over 5 Venus days. Panels show air temperatures (a), vertical winds (b), zonal winds (c), and meridional winds (d) at three altitude levels: deep atmosphere (−30 km), lower clouds (~50 km), and cloud top (~70 km). Black contours indicate the underlying surface topography, with elevations corresponding to major highland regions. Undulations on each horizontal slice represent the absolute values of anomalies scaled by two standard deviations (〈X〉′/2σ) to enhance visibility in the 3D perspective.
Current usage metrics show cumulative count of Article Views (full-text article views including HTML views, PDF and ePub downloads, according to the available data) and Abstracts Views on Vision4Press platform.
Data correspond to usage on the plateform after 2015. The current usage metrics is available 48-96 hours after online publication and is updated daily on week days.
Initial download of the metrics may take a while.