Fig. 8
Download original image
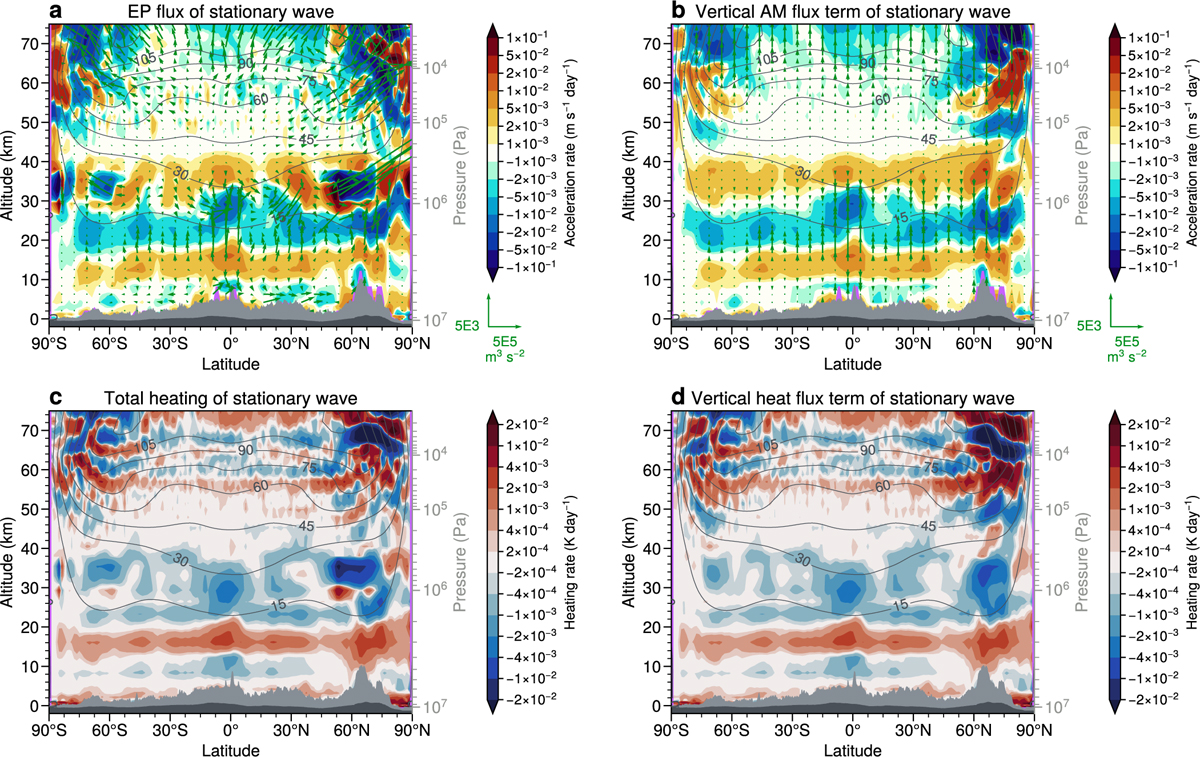
AM transport (a and b) and adiabatic heating (c and d) associated with stationary waves in the Venus PCM. Panels a and b: EP flux and the vertical flux of AM (arrows; both divided by basic air density), along with the corresponding zonal wind acceleration (color shading). Panels c and d: Adiabatic heating induced by stationary waves and the associated vertical heat flux component. Light and dark gray shading indicates, respectively, the maximum and mean surface topography at each latitude. Black contours represent the background zonal wind (m/s).
Current usage metrics show cumulative count of Article Views (full-text article views including HTML views, PDF and ePub downloads, according to the available data) and Abstracts Views on Vision4Press platform.
Data correspond to usage on the plateform after 2015. The current usage metrics is available 48-96 hours after online publication and is updated daily on week days.
Initial download of the metrics may take a while.