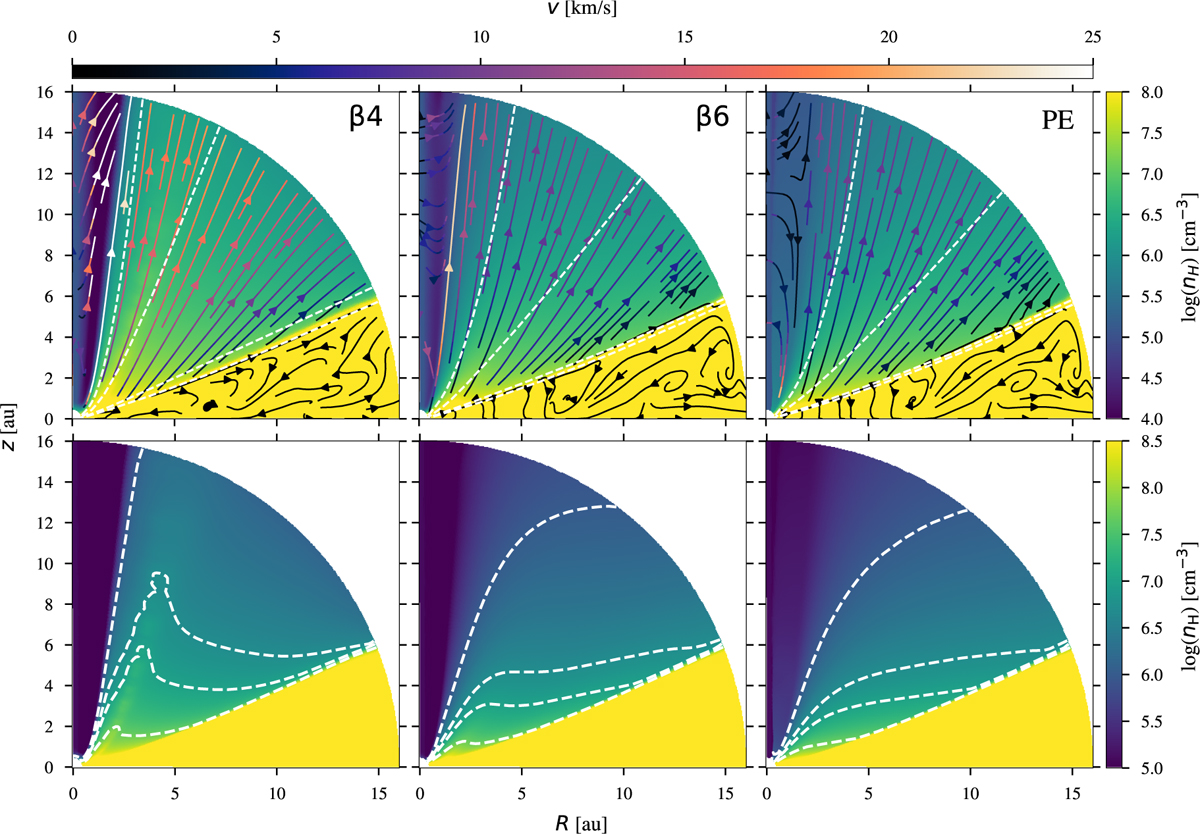
Fig. 1
Download original image
Number density maps for the three models β4, β6, and PE (columns from left to right). In the top row, streamlines represent the velocity structure, and their colour represents the speed. Dashed white lines are column density contours for the values (from top to bottom) 1020, 1021, 1022, and 2.5 · 1022 cm−2. In the bottom row, dashed white lines are density contours for the values (from top to bottom) 106, 5 · 106, 107, and 5 · 107 cm−3.
Current usage metrics show cumulative count of Article Views (full-text article views including HTML views, PDF and ePub downloads, according to the available data) and Abstracts Views on Vision4Press platform.
Data correspond to usage on the plateform after 2015. The current usage metrics is available 48-96 hours after online publication and is updated daily on week days.
Initial download of the metrics may take a while.