Fig. 6
Download original image
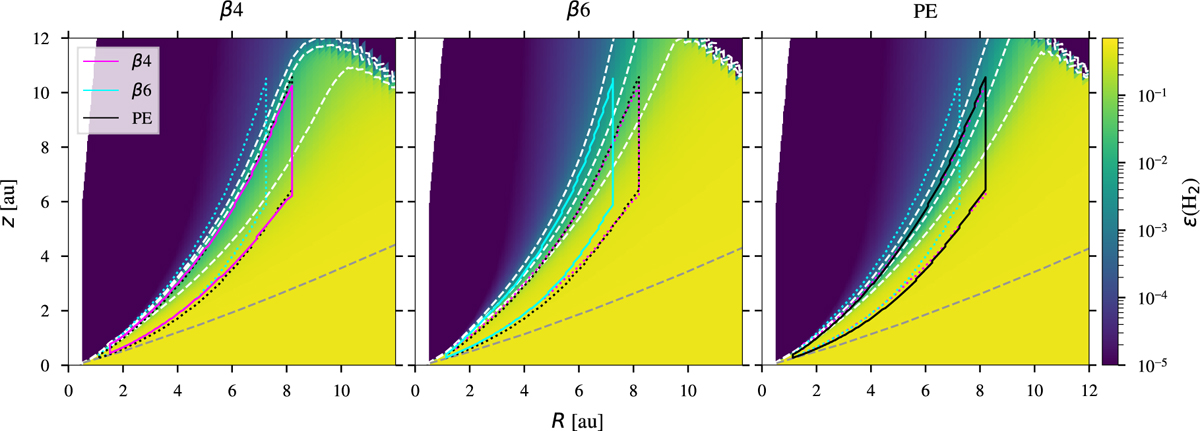
H2 abundance obtained by processing the models with PRODIMO. The dashed white lines are contours for values of (from top to bottom) 10−3, 10−2, and 10−1. The dashed grey lines represent the 2.5 · 1022 cm−2 radial column number density contour. The solid lines indicate where the o-H2 2.12 μm emission reaches 15% and 85% in the radial (integrated inside out) and vertical (integrated from top to bottom) directions. For better comparison, each panel also contains the emission regions of the other models, shown as dotted lines.
Current usage metrics show cumulative count of Article Views (full-text article views including HTML views, PDF and ePub downloads, according to the available data) and Abstracts Views on Vision4Press platform.
Data correspond to usage on the plateform after 2015. The current usage metrics is available 48-96 hours after online publication and is updated daily on week days.
Initial download of the metrics may take a while.