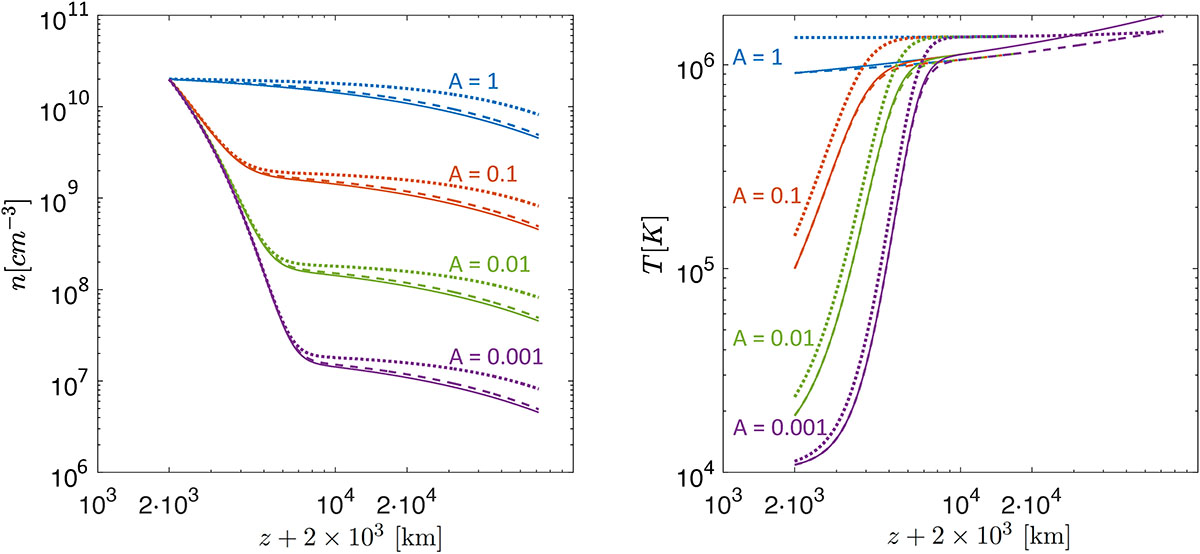
Fig. 3.
Download original image
Left panel: Number density profiles per cubic centimeter as a function of height in kilometers computed using the distribution of heating events γ1(T) given by Eq. (23) (solid), γ2(T) given by Eq. (24) (dashed) and γ3(T) given by Eq. (25) (dotted). Blue lines correspond to A = 1, red lines to A = 0.1, green lines to A = 0.01, and purple lines to A = 0.001. Right panel: temperature profiles T[K] as functions of the height expressed in km. The profiles are computed for the same distribution functions of the left column. Moreover the same colour coding and line style has been used.
Current usage metrics show cumulative count of Article Views (full-text article views including HTML views, PDF and ePub downloads, according to the available data) and Abstracts Views on Vision4Press platform.
Data correspond to usage on the plateform after 2015. The current usage metrics is available 48-96 hours after online publication and is updated daily on week days.
Initial download of the metrics may take a while.