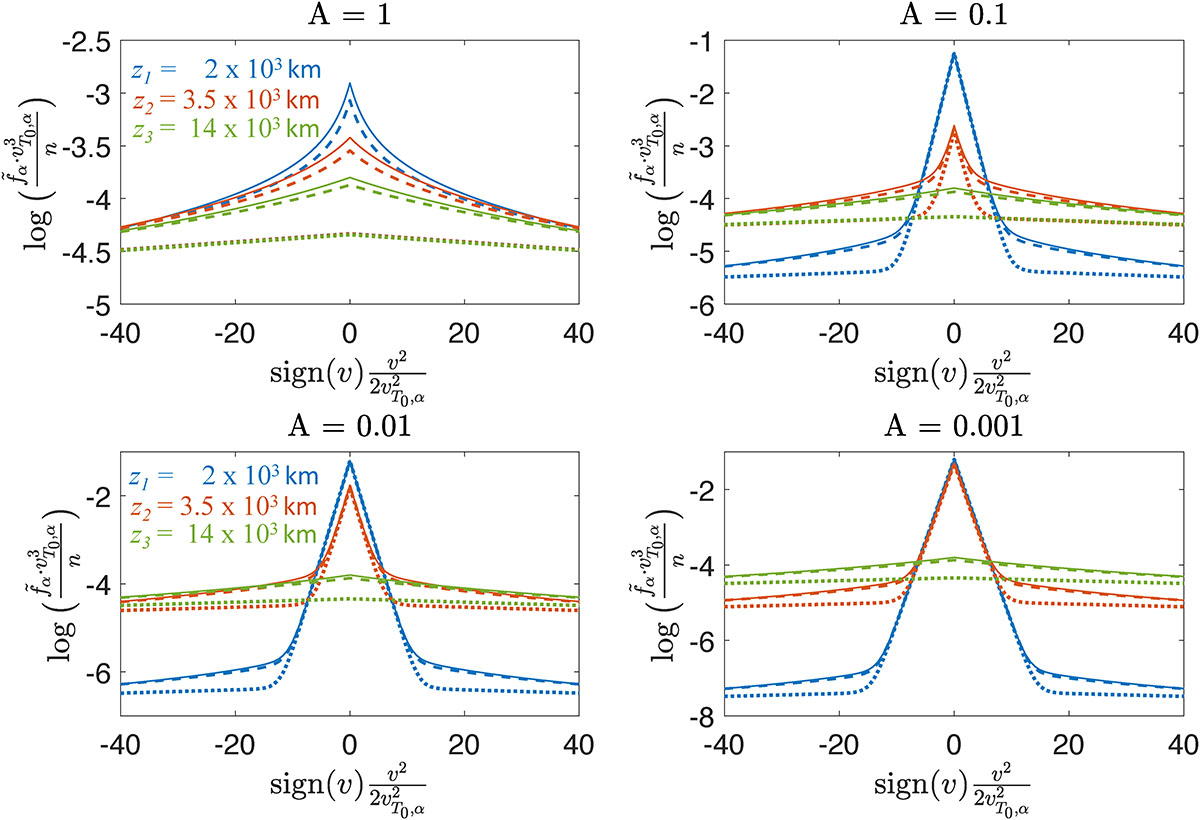
Fig. 4.
Download original image
Decimal logarithm of the velocity distribution functions (VDFs), for species α, plotted as a function of the signed kinetic energy normalized by vT0, α2. The VDFs are scaled by the corresponding number densities and normalized by vT0, α3, where vT0, α is defined by Eq. (31). Each panel compute the VDFs for different values of A as shown in the subplot title. In each panel the VDFs are computed using the three distribution of temperature increments γ1(T) defined in Eq. (23) (solid), γ2(T) defined in Eq. (24) (dashed) and γ3(T) defined in Eq. (22) (dotted). Finally, in each panel, the VDFs are shown at three different heights (see their positions in Fig. 3): z1 = 2 × 10³ km (base location, blue), z2 = 3.5 × 10³ km (transition region, red), and z3 = 14 × 103 km (corona, green).
Current usage metrics show cumulative count of Article Views (full-text article views including HTML views, PDF and ePub downloads, according to the available data) and Abstracts Views on Vision4Press platform.
Data correspond to usage on the plateform after 2015. The current usage metrics is available 48-96 hours after online publication and is updated daily on week days.
Initial download of the metrics may take a while.