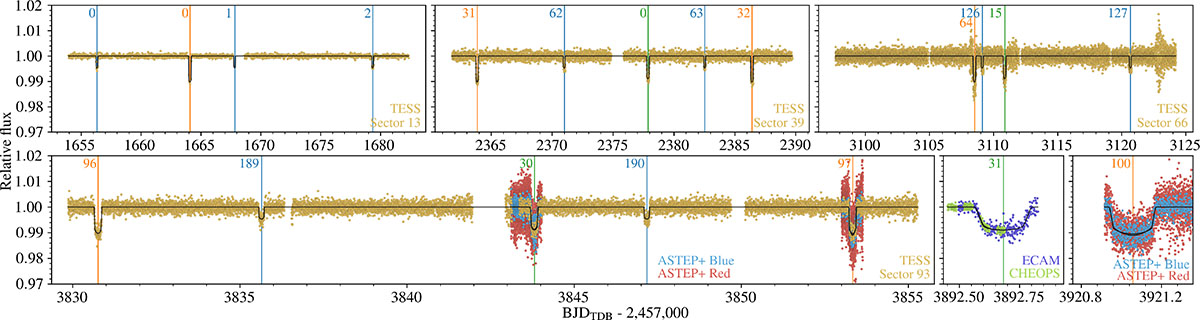
Fig. 2.
Download original image
Photodynamical modeling of the transit photometry. The dots, color coded by telescope, represent the noise-model-corrected observations. The black line shows the transit model. Vertical lines mark the midtransit time of planets b (blue), c (orange), and d (green) and are labeled by the number of orbital periods since the first observed transit.
Current usage metrics show cumulative count of Article Views (full-text article views including HTML views, PDF and ePub downloads, according to the available data) and Abstracts Views on Vision4Press platform.
Data correspond to usage on the plateform after 2015. The current usage metrics is available 48-96 hours after online publication and is updated daily on week days.
Initial download of the metrics may take a while.