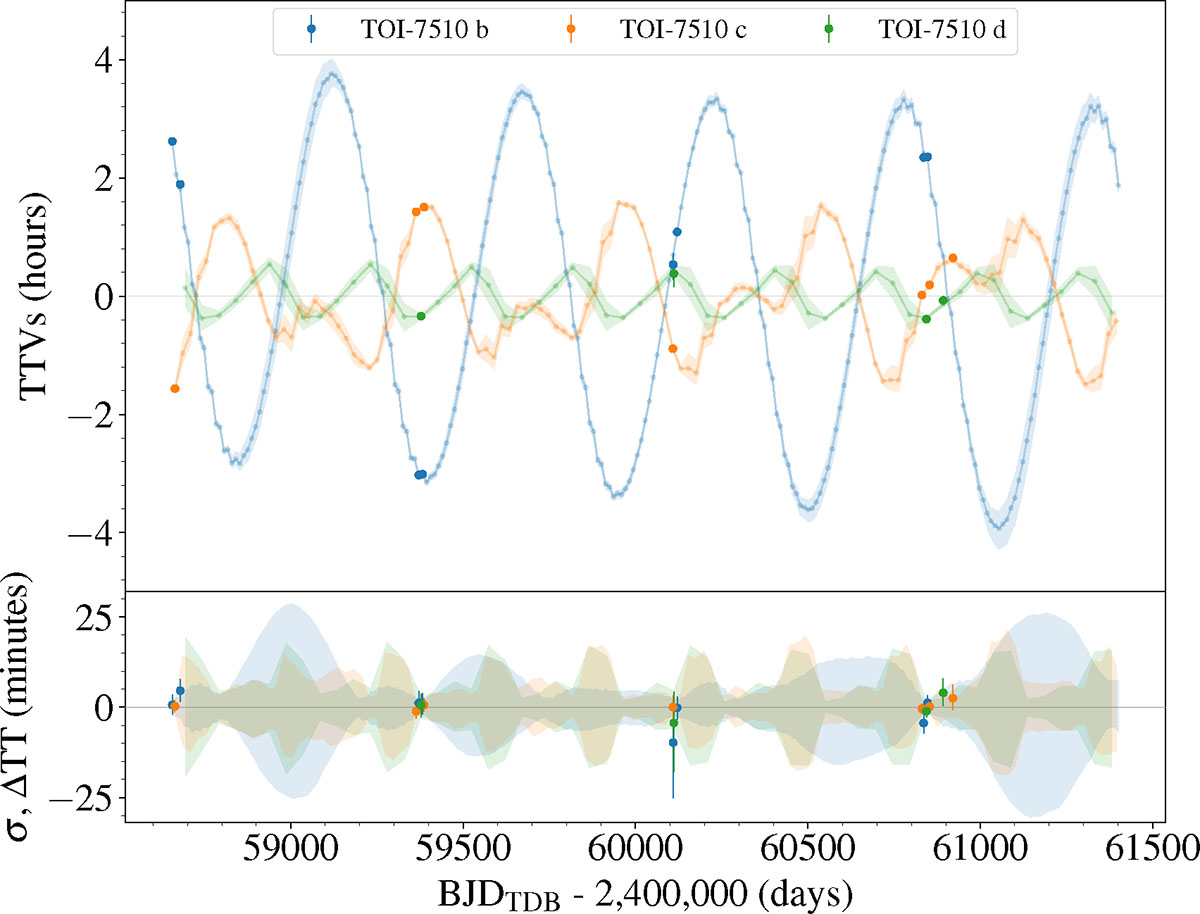
Fig. 3.
Download original image
Posterior TTV predictions of planets b (blue band), c (orange band), and d (green band) computed relative to a linear ephemeris (Table D.3). A thousand random draws from the posterior distribution were used to estimate the median TTV values and their uncertainties (68.3% confidence interval). The upper panel shows the posterior TTV values and compares them with the individual transit-time determinations (Table D.2, error bars). In the lower panel, the posterior median transit-timing value was subtracted to emphasize the uncertainty in the distribution and facilitate a clearer comparison with the individually determined transit times.
Current usage metrics show cumulative count of Article Views (full-text article views including HTML views, PDF and ePub downloads, according to the available data) and Abstracts Views on Vision4Press platform.
Data correspond to usage on the plateform after 2015. The current usage metrics is available 48-96 hours after online publication and is updated daily on week days.
Initial download of the metrics may take a while.