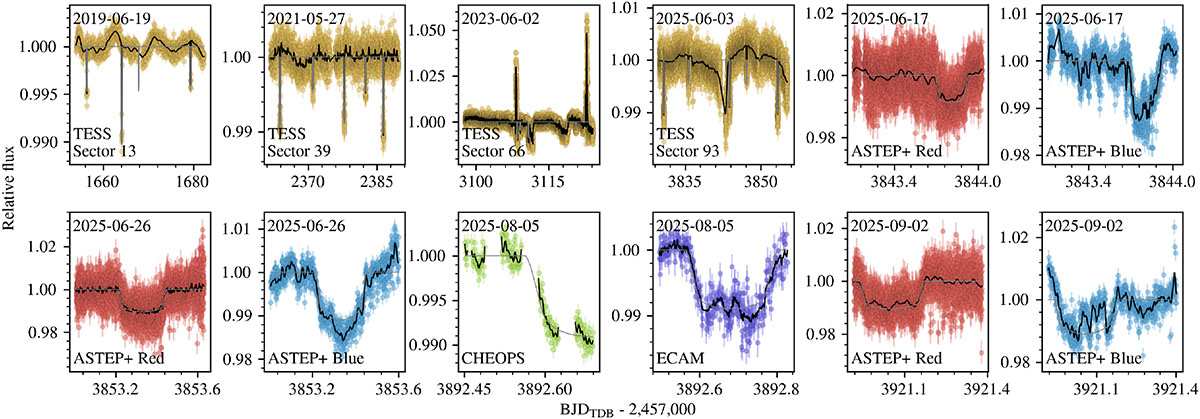
Fig. C.1.
Download original image
Photodynamical modeling of the transit photometry. Each dataset is shown in a different panel, labeled with the midtransit date (or the start date of the observation for TESS) and the telescope (or instrument). The error bars, in different colors for each telescope (same color code as in Fig. 2), represent the observations. The black line is the MAP model that combines both transits and noise, while the gray line shows the pure transit model.
Current usage metrics show cumulative count of Article Views (full-text article views including HTML views, PDF and ePub downloads, according to the available data) and Abstracts Views on Vision4Press platform.
Data correspond to usage on the plateform after 2015. The current usage metrics is available 48-96 hours after online publication and is updated daily on week days.
Initial download of the metrics may take a while.