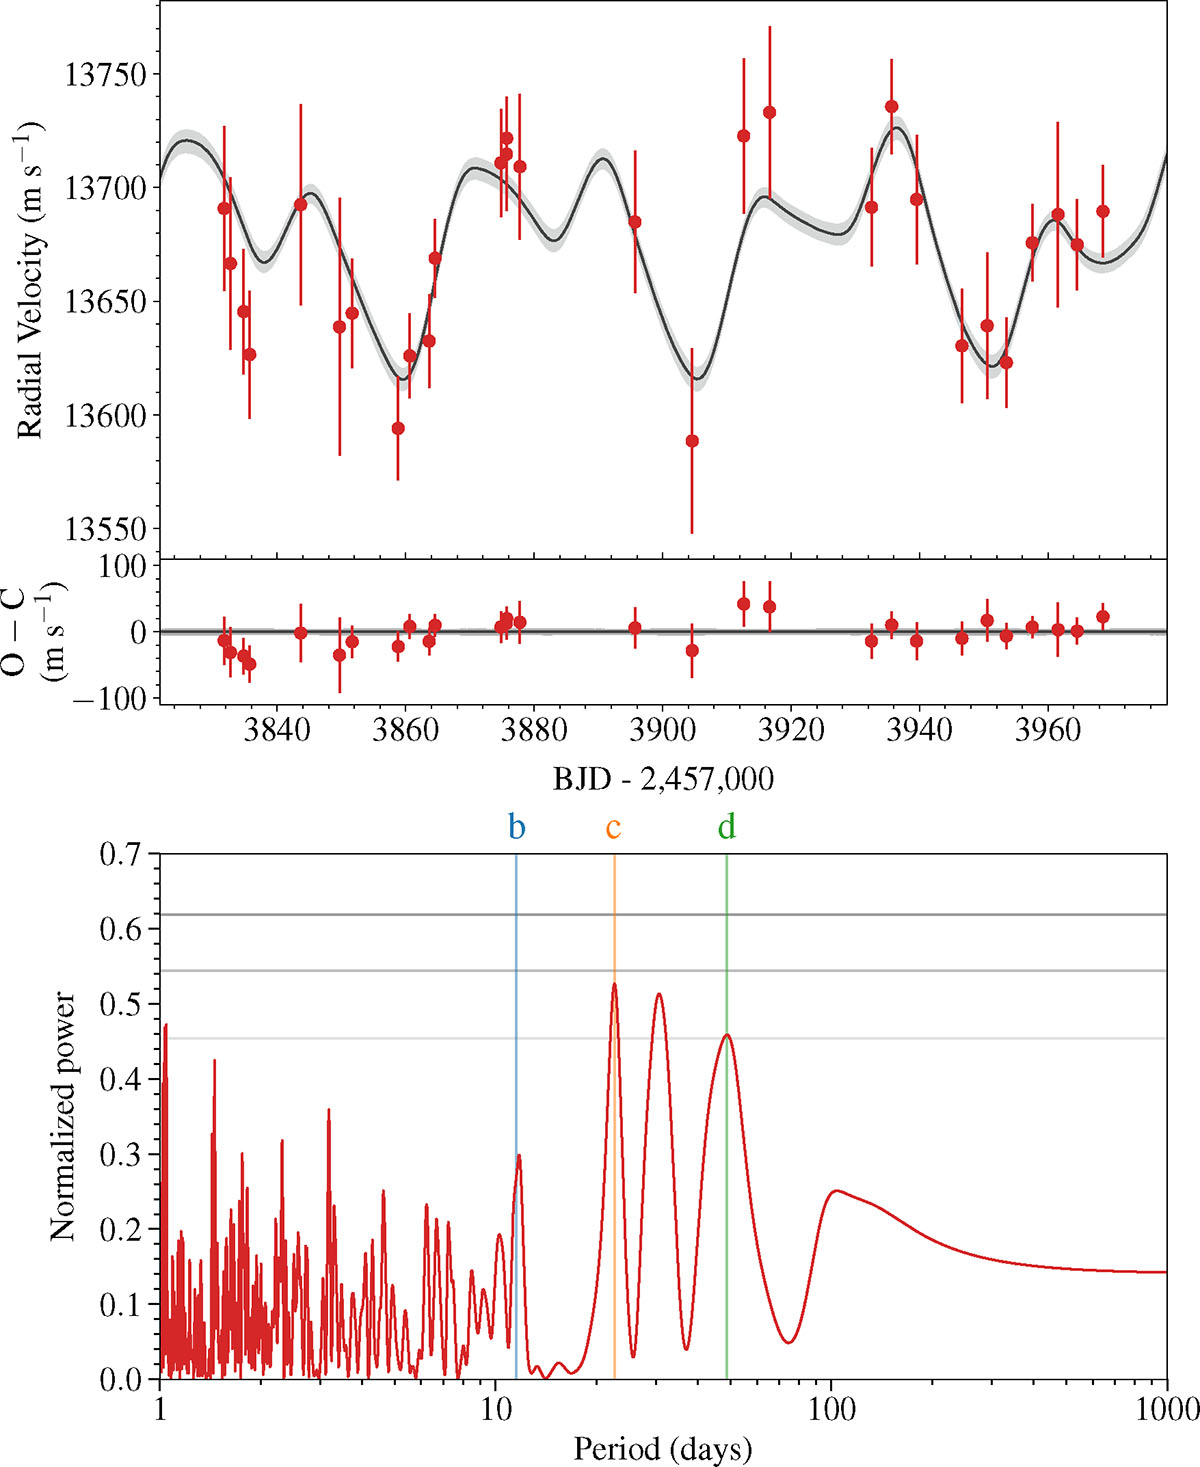
Fig. C.3.
Download original image
Top panel: CORALIE RVs of TOI-7510 (red error bars) together with the median RV model (black line) and the 68.3% confidence interval (gray region), both estimated from a thousand random draws from the posterior distribution. Residuals from the median model are shown. Bottom panel: Periodogram of the CORALIE RVs. The red line represents the Generalised Lomb–Scargle periodogram (Zechmeister & Kürster 2009). The gray horizontal lines represent 10, 1, and 0.1% false-alarm levels, from bottom to top. The vertical blue, orange, and green lines respectively mark the period of the transiting planets b, c, and d.
Current usage metrics show cumulative count of Article Views (full-text article views including HTML views, PDF and ePub downloads, according to the available data) and Abstracts Views on Vision4Press platform.
Data correspond to usage on the plateform after 2015. The current usage metrics is available 48-96 hours after online publication and is updated daily on week days.
Initial download of the metrics may take a while.