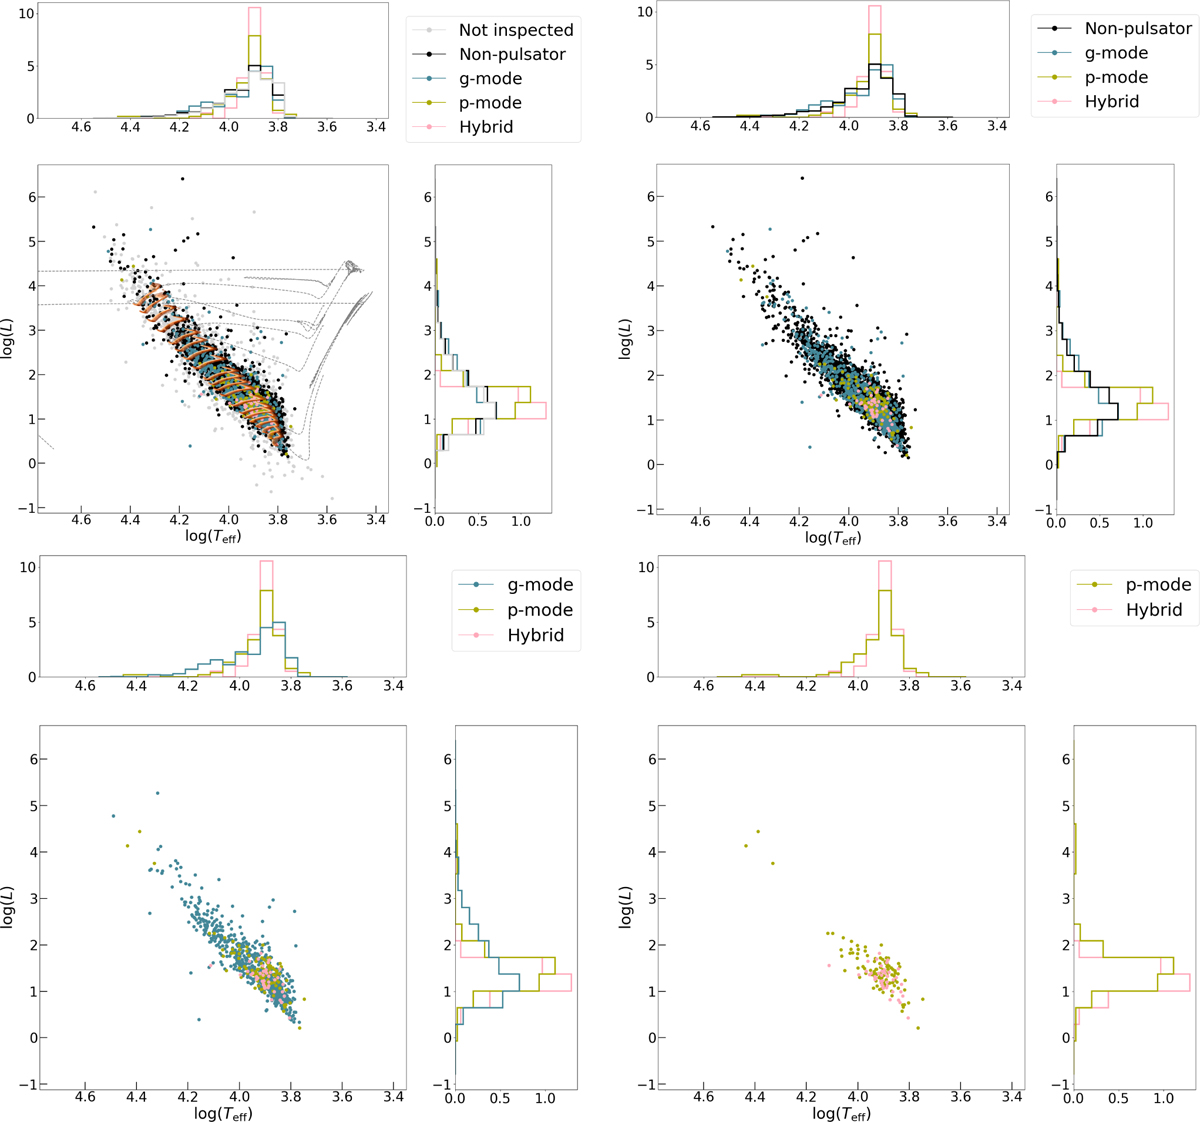
Fig. 1
Download original image
Hertzsprung-Russel diagram of all systems with Gaia measurements for the effective temperature and luminosity with adjoining histograms showing the density distributions for luminosity and temperature for each sub-class for each panel. The upper-left panel also shows solar metallicity (Z=0.014) evolutionary tracks from 1.2 to 9 M⊙ from M24 (solid red/yellow) computed using an exponentially decaying core-boundary mixing prescription (fov of 0.015) along with full 1.3 M⊙, 5 M⊙, and 9 M⊙ MIST tracks (grey dashed, Choi et al. 2016). The coloured variation in each of the M24 tracks shows the effect of varying the rotation from 5-55% (red-yellow) of the initial Keplerian critical rotation frequency.
Current usage metrics show cumulative count of Article Views (full-text article views including HTML views, PDF and ePub downloads, according to the available data) and Abstracts Views on Vision4Press platform.
Data correspond to usage on the plateform after 2015. The current usage metrics is available 48-96 hours after online publication and is updated daily on week days.
Initial download of the metrics may take a while.