Fig. A.3
Download original image
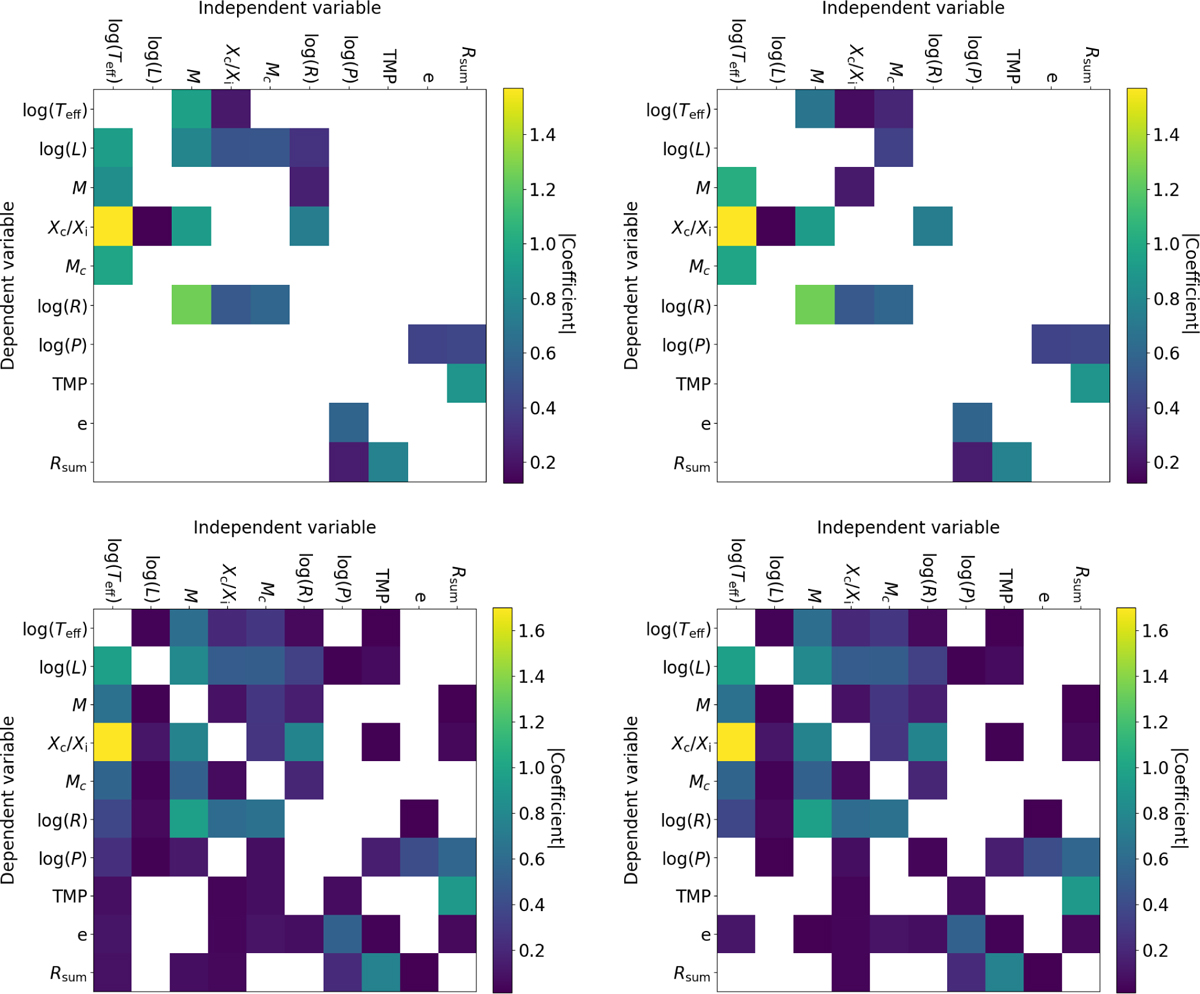
Results of our MLR-based importance analysis. For each dependent variable, a predictive model relying on linear regression is built by iteratively adding (forward method) or removing (reverse method) independent variables according to their contribution to the R2 of the linear model. This process is then repeated for each (dependent) variable. All variables are normalised to have a mean of 0 and a standard deviation of 1. Each pixel is coloured by the absolute value of the coefficient for each independent variable in the resulting linear model, where a higher absolute value of the coefficient implies higher importance of the independent variable in predicting the behaviour of the dependent variable. The left panels show the results of the reverse method (removing variables one at a time based on their R2 contribution), while the right panels show the results of the forward method (adding variables one at a time based on their R2 contribution). The two upper panels enforce a stopping criterion demanding at least a 0.01 improvement in R2, while the two lower panels have a more relaxed stopping criterion that demands only a 0.0001 improvement in R2.
Current usage metrics show cumulative count of Article Views (full-text article views including HTML views, PDF and ePub downloads, according to the available data) and Abstracts Views on Vision4Press platform.
Data correspond to usage on the plateform after 2015. The current usage metrics is available 48-96 hours after online publication and is updated daily on week days.
Initial download of the metrics may take a while.