Fig. 1.
Download original image
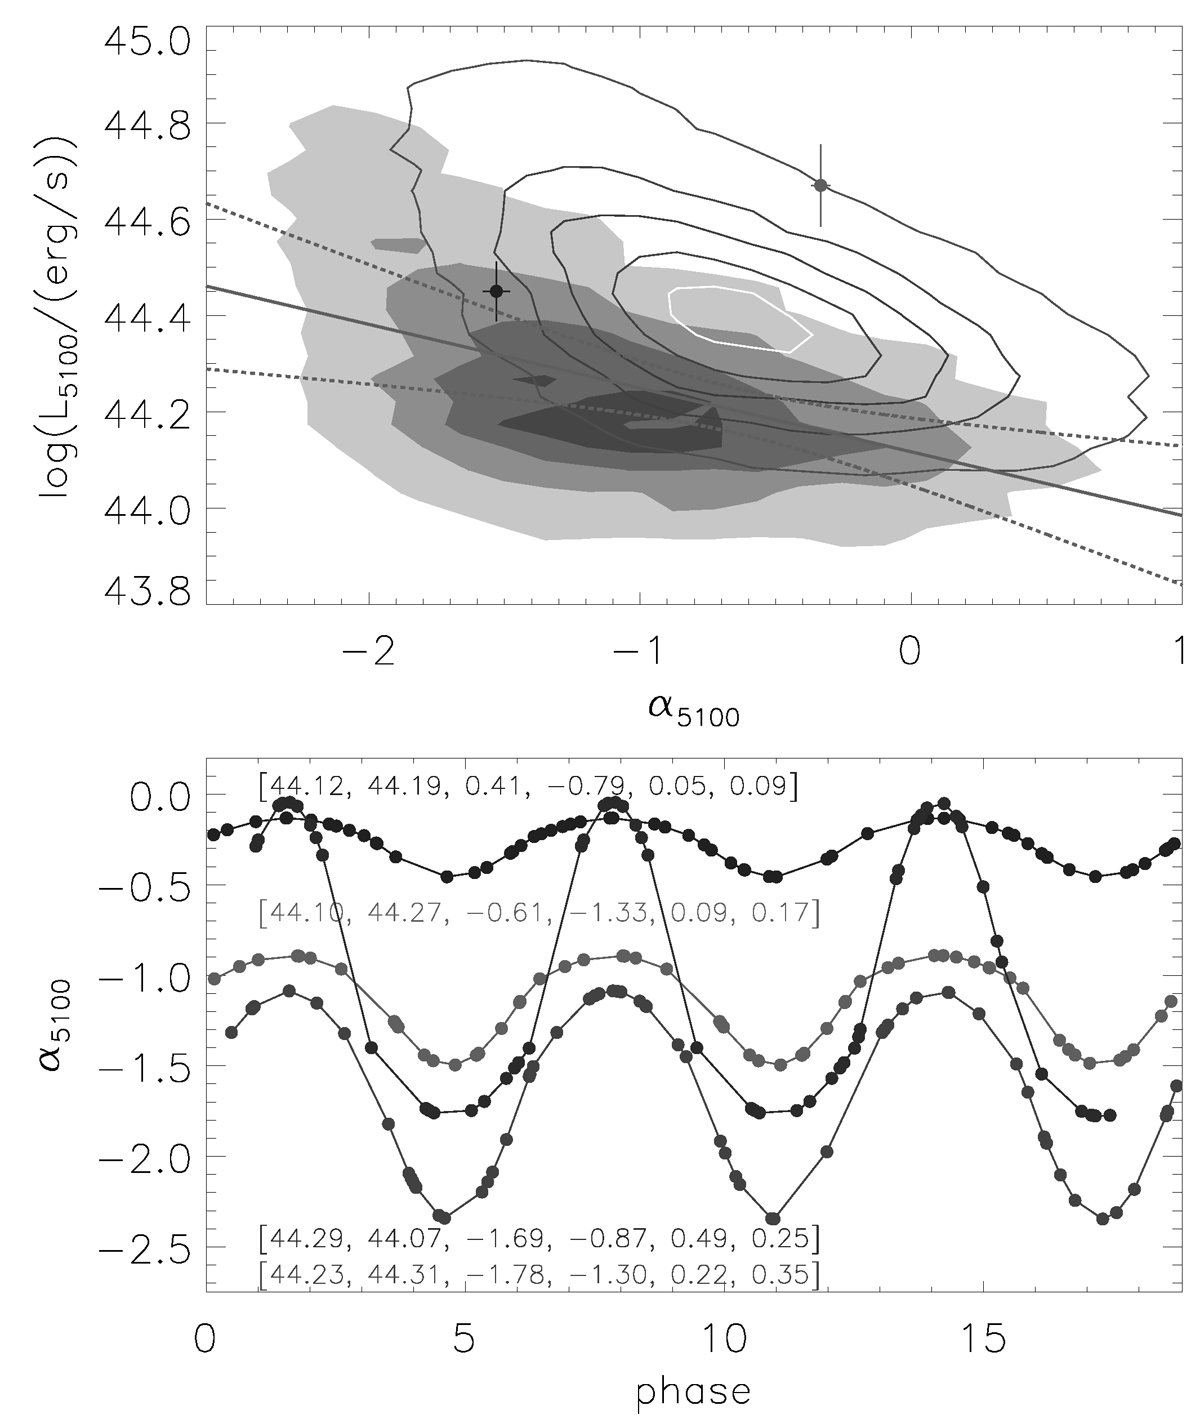
Properties of α5100. Top panel: Contour (filled by greenish colors) for the correlation between L5100 and α5100 of the selected 3274 SDSS quasars. Circles plus error bars in blue and in red show the results of SDSS J0012-1022 with MJD = 52141 and 56628. Solid and dashed lines in red show the best-fitting results and the corresponding 5σ confidence bands. Contour with reddish levels represents the simulated results. The contour levels in each contour represent 0.1, 0.3, 0.5, 0.7, and 0.9 of the 2D volume contained. Bottom panel: Four examples on periodic variations in α5100 related to sub-pc BBHs, with corresponding six model parameters (log(L1), log(L2), α1, α2, E10) listed in the same color.
Current usage metrics show cumulative count of Article Views (full-text article views including HTML views, PDF and ePub downloads, according to the available data) and Abstracts Views on Vision4Press platform.
Data correspond to usage on the plateform after 2015. The current usage metrics is available 48-96 hours after online publication and is updated daily on week days.
Initial download of the metrics may take a while.