| Issue |
A&A
Volume 704, December 2025
|
|
|---|---|---|
| Article Number | L9 | |
| Number of page(s) | 5 | |
| Section | Letters to the Editor | |
| DOI | https://doi.org/10.1051/0004-6361/202557422 | |
| Published online | 05 December 2025 | |
Letter to the Editor
Variability of optical spectral index to support a central sub-parsec binary black hole system in quasar SDSS J001224-102226.51
Guangxi Key Laboratory for Relativistic Astrophysics, School of Physical Science and Technology, GuangXi University, No. 100, Daxue Road, Nanning 530004, P. R. China
⋆ Corresponding author: This email address is being protected from spambots. You need JavaScript enabled to view it.
Received:
26
September
2025
Accepted:
12
November
2025
Abstract
In this work, we use variations in optical spectral index, α5100, to detect central sub-parsec binary black hole systems (sub-pc BBHs) in broad line active galactic nuclei (BLAGNs) through apparent effects of obscurations on two central BH accreting systems. For sub-pc BBHs in BLAGNs, two main characteristics of α5100 can be expected. First, if a BLAGN harbours a central sub-pc BBH, the expected unique variability in α5100 should lead to the BLAGN being an outlier in the space of α5100 versus continuum luminosity, L5100, determined from normal BLAGNs. Second, BLAGNs harbouring central sub-pc BBHs can lead to periodic variations in α5100. Here, after checking the two-epoch Sloan Digital Sky Survey (SDSS) spectra of quasar SDSS J0012-1022 reported as a candidate of sub-pc BBH by a large velocity offset between narrow and broad Balmer emission lines, the unique variability of α5100 can be explained by the effects of obscurations related to an assumed central sub-pc BBH. The results of this work provide a new method of detecting sub-pc BBHs in BLAGNs through the application of properties of optical continuum emissions. In the near future, detecting and reporting periodic variations of α5100 for sub-pc BBHs in BLAGNs should be main objective of our research group.
Key words: galaxies: active / galaxies: nuclei / quasars: supermassive black holes
© The Authors 2025
 Open Access article, published by EDP Sciences, under the terms of the Creative Commons Attribution License (https://creativecommons.org/licenses/by/4.0), which permits unrestricted use, distribution, and reproduction in any medium, provided the original work is properly cited.
This article is published in open access under the Subscribe to Open model. This email address is being protected from spambots. You need JavaScript enabled to view it. to support open access publication.
1. Introduction
Sub-parsec binary black hole systems (sub-pc BBHs) in broad line active galactic nuclei (BLAGNs) have been accepted as the main targets for gravitational wave signals at nano-Hz frequencies (Foster & Backer 1990; Arzoumanian et al. 2015; Sesana et al. 2018; Izquierdo-Villalba et al. 2022; Reardon et al. 2023; Petrov et al. 2024; Somalwar & Ravi 2025; Truant et al. 2025), with the goal being to obtain further clues on the final stages of black hole (BH) merging, as discussed in Begelman et al. (1980), Mayer et al. (2010), Fragione et al. (2019), Mannerkoski et al. (2022), Avara et al. (2024). Therefore, it is necessary and meaningful to detect more candidates of sub-pc BBHs.
Different methods have been proposed for detecting sub-pc BBHs in BLAGNs through properties of photometric variability and spectroscopic features. Considering long-standing optical quasi-periodic oscillations (QPOs) with periodicities around hundreds to thousands of days related to orbital motions of sub-pc BBHs, optical QPOs detected in photometric variability have been accepted as indicators for sub-pc BBHs, as reported in Graham et al. (2015a,b), Charisi et al. (2016), Zheng et al. (2016), Zhang (2022a,b, 2023a, 2025a,c). Meanwhile, unique properties of spectroscopic emission line features have been applied to detect sub-pc BBHs. Eracleous et al. (2012) reported a sample of sub-pc BBH candidates through broad Hβ emission lines displaced from narrow emission lines with shifted velocities larger than 1000 km/s. Boroson & Lauer (2009) reported the sub-pc BBH candidate in SDSS J1536+0441 through unique double-peaked features in broad emission lines. Zhang (2021, 2023b, 2025b) have reported the sub-pc BBH candidates in SDSS J1547, SDSS J1257, and PG 1411+442 through different line profiles of broad Balmer emission lines.
Apart from the expected unique spectroscopic emission line properties, the intrinsic dependence of broad line luminosity on continuum luminosity (Greene & Ho 2005) should indicate spectroscopic continuum emissions (such as spectral index) in multi-epoch spectra could also provide efficient clues to support sub-pc BBHs in BLAGNs. Therefore, detecting and reporting such clues is the main objective of this work. Here, sub-pc BBHs with separations large enough are mainly considered, with little contribution of circumbinary disk (Noble et al. 2012; D’Orazio et al. 2015; Bowen et al. 2017; Noble et al. 2021; Avara et al. 2024) to the optical continuum emissions.
In Section 2, we present the spectroscopic results and main discussions of the BLAGN SDSS J001224-102226.51 (=SDSS J0012-1022), which shows unique variability properties of optical spectral index and provides further clues to support a central sub-pc BBH. Section 3 shows necessary discussions on optical QPOs in gr-band light curves from Zwicky Transient Facility (ZTF) (Bellm et al. 2019; Masci et al. 2019) in SDSS J0012-1022. The main conclusions are given in Section 4. Throughout the manuscript, we adopt the cosmological parameters of H0 = 70 km s−1 Mpc−1, Ωm = 0.3, and ΩΛ = 0.7.
2. Spectroscopic results for SDSS J0012-1022
Considering normal BLAGNs, there is an apparent dependence of optical spectral index, α5100 (fλ ∝ λα5100), underneath broad Hβ on continuum luminosity at 5100 Å L5100, as shown in the top panel of Fig. 1 for the selected 3274 low redshift (z < 0.35) SDSS quasars in Shen et al. (2011) with reliable measurements of α5100 (between –5 and 3) and L5100 (five times larger than the corresponding uncertainties), with a Spearman rank correlation coefficient of –0.51 (Pnull < 10−10). After considering the uncertainties in both coordinates through the least trimmed squares regression technique (Cappellari et al. 2013), the dependence can be described as  , with a RMS scatter of 0.149. The results are consistent with the results in Paltani & Courvoisier (1994), Schmidt et al. (2012), Patel et al. (2025) that the vast majority of BLAGNs become bluer when they become brighter.
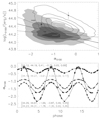 |
Fig. 1. Properties of α5100. Top panel: Contour (filled by greenish colors) for the correlation between L5100 and α5100 of the selected 3274 SDSS quasars. Circles plus error bars in blue and in red show the results of SDSS J0012-1022 with MJD = 52141 and 56628. Solid and dashed lines in red show the best-fitting results and the corresponding 5σ confidence bands. Contour with reddish levels represents the simulated results. The contour levels in each contour represent 0.1, 0.3, 0.5, 0.7, and 0.9 of the 2D volume contained. Bottom panel: Four examples on periodic variations in α5100 related to sub-pc BBHs, with corresponding six model parameters (log(L1), log(L2), α1, α2, E10) listed in the same color. |
Once a sub-pc BBH was assumed in a BLAGN, different obscurations (inevitably depending on inclination angle) on continuum emissions related to two BH accreting systems could naturally be expected. If a BLAGN harbouring a sub-pc BBH has a unique variability in the optical spectral index, it probably causes the BLAGN to be an outlier in the space of α5100 versus L5100 for the normal quasars, and such is the case in SDSS J0012-1022.
The object SDSS J0012-1022 is a quasar at redshift 0.228 in SDSS (Almeida et al. 2023), with its high-quality spectra (plate-mjd-fiberid = 0651-52141-0072 and 7169-56628-0344) observed at MJD = 52141 and 56628, shown in Fig. 2. The power law continuum emissions,  , underneath the broad Hβ can be determined by the continuum emissions with rest wavelength from 4180 to 4250Å and from 5550 to 5750Å through the Levenberg-Marquardt least-squares minimization technique (Markwardt 2009), leading to A = 36.16 ± 2.37, α5100 = −1.53 ± 0.05 and A = 59.29 ± 5.23, α5100 = −0.33 ± 0.04 for the spectrum with MJD = 52141 and 56628, respectively. In the top panel of Fig. 1, the determined α5100 and L5100 cause SDSS J0012-1022 with MJD = 52141 (solid blue circle) to lie in the common region in the space of α5100 versus L5100 for normal quasars. However, the determined values with MJD = 56628 apparently lead to SDSS J0012-1022 (solid red circle) being an outlier, with an opposite behavior in the space. In other words, when SDSS J0012-1022 became brighter from MJD = 52141 to 56628, the continuum emissions were not bluer but redder around 5100 Å.
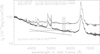 |
Fig. 2. Sloan Digital Sky Survey spectra of SDSS J0012-1022 with MJD = 52141 (in blue) and 56628 (in red). Dashed lines in blue and in red show the power-law function determined optical continuum emissions underneath broad Hβ through the two regions filled by dark green lines. The dashed purple line represents the first component related to the obscured power law component, shown as a dashed blue line with E(B-V) = 0.1, and the dashed dark green line shows the second component (formula listed in dark green characters) from the other system accreting one BH. The sum of the two components is one solution related to a sub-pc BBH to the continuum emissions in the spectrum with MJD = 56628. |
Based on the results in the top panel of Fig. 1 for SDSS J0012-1022, obscurations on optical continuum emissions in normal BLAGNs cannot be accepted. We then checked whether an assumed sub-pc BBH can be applied.
For an assumed sub-pc BBH, the observed optical continuum emissions f(λ) (λ from 4400 Å to 5600 Å in rest frame) actually include two sources of f1(λ, o) and f2(λ, o) with different spectral indices from two central BH accreting systems,
 (1)
(1)
with k1(λ, ϕ) and k2(λ, ϕ) (ϕ as orbital phase) representing effects of obscurations on intrinsic f1(λ)∝(λ/5100)α1 (continuum luminosity L1 at 5100 Å) and f2(λ)∝(λ/5100)α2 (continuum luminosity L2 at 5100 Å).
Meanwhile, k1(λ, ϕ) and k2(λ, ϕ) can be determined in a straight forward manner by evolutions of color excess E(B–V) described simply by the following periodic functions:
![Mathematical equation: $$ \begin{aligned} \begin{aligned} E_1(B-V,\phi )&=E_{10}\times |sin(\phi )| \ \ (\phi \in [\phi _1,\phi _2]), \\ E_1(B-V,\phi )& = 0 \ \ (\phi \in [0,~\phi _1] \ \ or \ [\phi _2,2\pi ]), \\ E_2(B-V,\phi )&=E_{20}\times |sin(\phi )| \ \ (\phi \in [0,\phi _1] \ \ or \ [\phi _2,2\pi ]), \\ E_2(B-V,\phi )& = 0 \ \ (\phi \in [\phi _1,\phi _2]). \end{aligned} \end{aligned} $$](/articles/aa/full_html/2025/12/aa57422-25/aa57422-25-eq4.gif) (2)
(2)
We applied the parameters of ϕ1 and ϕ2 (0 ≤ (ϕ2 − ϕ1) ≤ π) to determine the phase information for the existence of covered regions of one BH accreting system by the other system. The extinction curve in Fitzpatrick (1999) was accepted. Then, we assumed sub-pc BBHs and created an artificial f(λ) through the following steps.
First, among the 3274 SDSS quasars shown in the top panel of Fig. 1, two quasars were randomly selected, leading to the measured values of the two quasars as the intrinsic L1, α1 and L2, α2. Second, according to the redshift of one of the two selected quasars in the first step, f1(λ) and f2(λ) could be described as
 (3)
(3)
with D as the redshift-determined luminosity distance. Third, ϕ1 and 2π > ϕ2 > ϕ1 were randomly selected from 0 to π and from 0 to 2π, and E10 and E20 were randomly selected from 0 to 0.5, leading to determined k1(λ, ϕ) and k2(λ, ϕ). Here, the sampled range of E10 and E20 not only covers differences in the spectral index of the emitting sources but also accounts for a wide range of physical factors inherent to observing a sample of different orbiting systems. The artificial f(λ) could then be obtained with the equations listed above. Fourth, through the least-squares minimization technique, a power-law function,  , was applied to describe the artificial f(λ), and this lead to the determined spectral index, αA, and the continuum luminosity, LA, at 5100Å. Finally, by repeating the above steps 20 000 times, a sample of 20 000 artificial f(λ) was created.
The dependence of LA on αA is also shown in the top panel of Fig. 1 for the 20 000 artificial f(λ), apparently leading to the dependence of LA on αA moving to the upper right. We checked the effect of having different values of E10 and E20 and different periodic functions applied to describe E(B − V, ϕ). These variations lead to similar results but with more or less extended areas with a lower LA. Therefore, SDSS J0012-1022 with unique variability in α5100 as an outlier having opposite behavior in the space of L5100 versus α5100 can be explained by an assumed sub-pc BBH, mainly due to SDSS J0012-1022 well covered by the space of LA versus αA.
Before ending this section, five points should be noted. First, if the time duration of 4487 days from MJD = 52141 to 56628 of the two SDSS spectra of SDSS J0012-1022 is exactly an integer multiple of the orbital period of the assumed sub-pc BBH, the above discussions cannot be applied due to the same spatial structures for the two BH accreting systems at the two epochs. Therefore, it is necessary to check the orbital period in SDSS J0012-1022 related to an assumed sub-pc BBH. Second, through the procedure above with ϕ randomly from 0 to 6π, periodic variations of spectral index should be expected, such as the examples shown in the bottom panel of Fig. 1. And the example in purple with α5100 varying from –1.78 to –0.04, which is larger than the varying range in α5100 in SDSS J0012-1022, indicating a new method for detecting sub-pc BBHs in BLAGNs through periodic variation in spectral index. Third, for assumed sub-pc BBHs, Fig. 2 shows a solution to the continuum emissions with MJD = 56628 in SDSS J0012-1022; detailed descriptions are provided in Appendix A. Fourth, we assumed the continuum emissions from two central BH accreting systems to be similar to those of individual normal quasars. Actually, if considering modifications related to BBHs, further evidence can be found to better support our conclusions, such as the detailed descriptions in Appendix B. Fifth, in order to provide further clues on the importance of periodic obscurations for our conclusions, we considered constant extinctions with E1(B − V, ϕ) = E2(B − V, ϕ) = E0 in the same procedure above (detailed descriptions are given in Appendix C). The goal was to further confirm that periodic obscurations related to orbital motions have key roles in the unique variability properties of the optical spectral index in BLAGNs when harbouring sub-pc BBHs.
3. Optical QPOs in SDSS J0012-1022
The 6.3 years long ZTF gr-band light curves are shown in the left panel of Fig. 3 with t = MJD − 58200 from 88 to 2411. Based on applications of a base line plus a sine component,
 |
Fig. 3. Variability properties of SDSS J0012-1022. Left panel: ZTF gr-band (in blue and in red) light curves of SDSS J0012-1022. Solid and dot-dashed lines in blue and in red represent the best-fitting results and the corresponding 1RMS scatters for the gr-band light curves, while horizontal dashed lines in blue and in red show the determined base line components in the gr-band light curves. Middle panel: Determined LS powers of the gr-band (in blue and in red) light curves and the g–r color (in purple). The horizontal dashed red line represents the 5σ significance level (false alarm probability 3e–7), and the vertical dashed red line marks the periodicity (827 days). Top-left corner in middle panel: Distributions determined using the bootstrap method (in blue, red, and purple) of the 2000 redetermined periodicities through the ZTF gr-band light curves and through the g-r color. Right panel: g-r color, with solid and dot-dashed lines in purple as the best-fitting results and the corresponding 1RMS scatters. |
 (4)
(4)
and through the least-squares minimization technique, the best-fitting results of χ2/d.o.f. ∼ 5.5 for the gr-band light curves can lead to the determined optical periodicity of 827 ± 2 days. Here, due to the LC with t < 800 being about 0.2–0.25 magnitudes darker than in the LC with t > 800, two different base lines, B0 and C0, were applied for the LC with t < 800 and with t > 800.
We applied the commonly accepted Lomb-Scargle (LS) periodogram (Zechmeister & Kurster 2009; VanderPlas 2018) to the ZTF gr-band light curves of SDSS J0012-1022 after subtractions of the base line components, leading to an apparent periodicity of around 820 days with significance levels higher than 5σ, as shown in the middle panel of Fig. 3. We then applied the bootstrap method within 2000 loops to determine the periodicity distributions. For each loop, about half of the data points were randomly selected from the original gr-band light curves, leading to the redetermined LS periodicities through the re-created light curves. The distributions of the 2000 redetermined periodicities, shown in the top-left corner of the middle panel of Fig. 3, led to the determined optical periodicity of 825 ± 6 days and 826 ± 6 days through the gr-band light curves.
Furthermore, as discussed in Vaughan et al. (2016) and in our recent works in Zhang (2023a,b), Liao et al. (2025), Zhang (2025b), there are apparent effects of red noise (caused by stochastic active galactic nuclei variability) on the detection of optical QPOs. Here, a simple procedure was applied to check the effects of red noise on optical QPOs in SDSS J0012-1022. By accepting the continuous autoregressive (CAR) process described in Kelly et al. (2009) to describe red noise, the probability of detecting fake QPOs could be estimated through a series of simulated light curves. The CAR process parameters are the intrinsic variability timescale, τ, and amplitude, σ*. As also discussed in Kozlowski et al. (2010) for normal quasars, the τ/days can be randomly selected from 100 to 1500, and σ∗/(mag/days0.5) can be randomly selected from 0.003 to 0.03. Then, 100 000 artificial light curves with the same time information of the ZTF g-band light curve of SDSS J0012-1022 can be created by the CAR process with a mean magnitude of about 17.5 mags (i.e., the mean value of the ZTF g-band light curve of SDSS J0012-1022). Then, the LS periodogram was applied to detect optical QPOs with a significance level higher than 5σ and with a periodicity within the range of 800 to 850 days. This led to 140 artificial light curves being selected. Therefore, the probability of detecting fake optical QPOs through the CAR process simulated artificial light curves is only about 0.14% (140/1d5). In other words, the confidence level should be at least higher than 3.2σ to support the detected optical QPOs in SDSS J0012-1022 are not from red noise.
Therefore, the optical QPOs with a periodicity of 827±6 days can be accepted in SDSS J0012-1022, leading the time duration of 4487 days from MJD = 52141 to 56628 to be  times of the periodicity. Therefore, for an assumed sub-pc BBH with different phases, there are different spatial structures for the two BH accreting systems at the two epochs in SDSS J0012-1022, thus supporting the discussions on an assumed sub-pc BBH to explain the unique variability of spectral indices in SDSS J0012-1022.
The properties of g-r color shown in the right panel of Fig. 3 are discussed, because the photometric g-r color can be applied to trace spectroscopic optical spectral index. The corresponding LS powers of the g-r color shown in the middle panel of Fig. 3 can lead to the determined periodicity of 828 ± 23 days, with the uncertainty determined by the bootstrap method. Meanwhile, as shown in right panel of Fig. 3, the g-r color can be well modeled by a sine function with a periodicity of 819 ± 19 days plus a linear trend, leading to the best-fitting results with χ2/d.o.f. ∼ 1.07. Meanwhile, through the F-test technique applied to compare a sine plus linear model with a linear model, the sine component is preferred with a confidence level higher than 10σ, as described in Appendix D. The periodicity determined in the g-r color is consistent with the ones determined in the gr-band light curves. Therefore, the QPOs in the g-r color can be accepted as further clues to support our conclusions above, and to further support a central sub-pc BBH in SDSS J0012-1022.
4. Conclusions
When considering time-dependent periodic obscurations of central BH accreting systems in sub-pc BBHs, unique variability properties of optical continuum emissions are considered as clues to support central sub-pc BBHs in BLAGNs. Through oversimplified simulations, we find that the variability in α5100 in multi-epoch spectra that causes BLAGNs to be outliers in the space of α5100 versus L5100 could be accepted as clues to support central sub-pc BBHs, for example, in the results in SDSS J0012-1022, which has a unique variability pattern for dependence of α5100 on L5100 that is very different from normal SDSS quasars. Meanwhile, periodic variations of optical spectral index could be expected in BLAGNs harboring assumed sub-pc BBHs. The results in this paper open a new path for detecting sub-pc BBHs by applications of spectroscopic properties of optical continuum emissions as well as commonly applied optical QPOs.
Acknowledgments
Zhang gratefully acknowledge the anonymous referee for giving us constructive comments and suggestions to greatly improve the paper. Zhang gratefully thanks the kind financial support from GuangXi University and the kind grant support from NSFC-12173020 and NSFC-12373014 and the support from Guangxi Talent Programme (Highland of Innovation Talents). This manuscript has made use of the data from SDSS (https://www.sdss.org/) and ZTF (https://www.ztf.caltech.edu/).
References
- Almeida, A., Anderson, S. F., Argudo-Fernandez, M., et al. 2023, ApJS, 267, 44 [NASA ADS] [CrossRef] [Google Scholar]
- Arzoumanian, Z., Brazier, A., Burke-Spolaor, S., et al. 2015, ApJ, 813, 65 [NASA ADS] [CrossRef] [Google Scholar]
- Avara, M. J., Krolik, J. H., Campanelli, M., et al. 2024, ApJ, 974, 242 [Google Scholar]
- Begelman, M. C., Blandford, R. D., & Rees, M. J. 1980, Natur, 287, 307 [Google Scholar]
- Bellm, E. C., Kulkarni, S. R., Graham, M. J., et al. 2019, PASP, 131, 018002 [Google Scholar]
- Boroson, T. A., & Lauer, T. R. 2009, Nature, 458, 53 [Google Scholar]
- Bowen, D. B., Campanelli, M., Krolik, J. H., Mewes, V., & Noble, S. C. 2017, ApJ, 838, 42 [CrossRef] [Google Scholar]
- Cappellari, M., Scott, N., Alatalo, K., et al. 2013, MNRAS, 432, 1709 [Google Scholar]
- Charisi, M., Bartos, I., Haiman, Z., et al. 2016, MNRAS, 463, 2145 [Google Scholar]
- D’Orazio, D. J., Haiman, Z., Duffell, P., Farris, B. D., & MacFadyen, A. I. 2015, MNRAS, 452, 2540 [CrossRef] [Google Scholar]
- Eracleous, M., Boroson, T. A., Halpern, J. P., & Liu, J. 2012, ApJS, 201, 23 [Google Scholar]
- Fitzpatrick, E. L. 1999, PASP, 111, 63 [Google Scholar]
- Foster, R. S., & Backer, D. C. 1990, ApJ, 361, 300 [NASA ADS] [CrossRef] [Google Scholar]
- Fragione, G., Grishin, E., Leigh, N. W. C., Perets, H. B., & Perna, R. 2019, MNRAS, 488, 47 [NASA ADS] [CrossRef] [Google Scholar]
- Graham, M. J., Djorgovski, S. G., Stern, D., et al. 2015a, Nature, 518, 74 [Google Scholar]
- Graham, M. J., Djorgovski, S. G., Stern, D., et al. 2015b, MNRAS, 453, 1562 [Google Scholar]
- Greene, J. E., & Ho, L. C. 2005, ApJ, 627, 721 [NASA ADS] [CrossRef] [Google Scholar]
- Izquierdo-Villalba, D., Sesana, A., Bonoli, S., & Colpi, M. 2022, MNRAS, 509, 3488 [Google Scholar]
- Kelly, B. C., Bechtold, J., & Siemiginowska, A. 2009, ApJ, 698, 895 [Google Scholar]
- Kozlowski, S., Kochanek, C. S., Udalski, A., et al. 2010, ApJ, 708, 927 [CrossRef] [Google Scholar]
- Liao, G. L., Chen, X. Q., Zheng, Q., Liu, Y. L., & Zhang, X. G. 2025, A&A, 698, A265 [NASA ADS] [CrossRef] [EDP Sciences] [Google Scholar]
- Mannerkoski, M., Johansson, P. H., Rantala, A., et al. 2022, ApJ, 929, 167 [NASA ADS] [CrossRef] [Google Scholar]
- Markwardt, C. B. 2009, ASPC, 411, 251 [Google Scholar]
- Masci, F. J., Laher, R. R., Rusholme, B., et al. 2019, PASP, 131, 018003 [Google Scholar]
- Mayer, L., Kazantzidis, S., Escala, A., & Callegari, S. 2010, Nature, 466, 1082 [Google Scholar]
- Noble, S. C., Mundim, B. C., Nakano, H., et al. 2012, ApJ, 755, 51 [NASA ADS] [CrossRef] [Google Scholar]
- Noble, S. C., Krolik, J. H., Campanelli, M., et al. 2021, ApJ, 922, 175 [NASA ADS] [CrossRef] [Google Scholar]
- Paltani, S., & Courvoisier, T. J. L. 1994, A&A, 291, 74 [NASA ADS] [Google Scholar]
- Patel, P., Lira, P., Arevalo, P., et al. 2025, A&A, 695, A162 [NASA ADS] [CrossRef] [EDP Sciences] [Google Scholar]
- Petrov, P., Taylor, S. R., Charisi, M., & Ma, C.-P. 2024, ApJ, 976, 129 [Google Scholar]
- Popovic, L. C., Simic, S., Kovacevic, A., & Ilic, D. 2021, MNRAS, 505, 5192 [CrossRef] [Google Scholar]
- Reardon, D. J., Zic, A., Shannon, R. M., et al. 2023, ApJ, 951, L6 [NASA ADS] [CrossRef] [Google Scholar]
- Schmidt, K. B., Rix, H. W., Shields, J. C., et al. 2012, ApJ, 744, 147 [Google Scholar]
- Sesana, A., Haiman, Z., Kocsis, B., & Kelley, L. Z. 2018, ApJ, 856, 42 [Google Scholar]
- Shen, Y., Richards, G. T., Strauss, M. A., et al. 2011, ApJS, 194, 45 [Google Scholar]
- Somalwar, J. J., & Ravi, V. 2025, ApJ, 982, 195 [Google Scholar]
- Truant, R. J., Izquierdo-Villalba, D., Sesana, A., Shaifullah, G. M., & Bonetti, M. 2025, A&A, 694, A282 [NASA ADS] [CrossRef] [EDP Sciences] [Google Scholar]
- VanderPlas, J. T. 2018, ApJS, 236, 16 [Google Scholar]
- Vaughan, S., Uttley, P., Markowitz, A. G., et al. 2016, MNRAS, 461, 3145 [Google Scholar]
- Zechmeister, M., & Kurster, M. 2009, A&A, 496, 577 [CrossRef] [EDP Sciences] [Google Scholar]
- Zhang, X. G. 2021, MNRAS, 507, 5205 [NASA ADS] [CrossRef] [Google Scholar]
- Zhang, X. G. 2022a, MNRAS, 512, 1003 [Google Scholar]
- Zhang, X. G. 2022b, MNRAS, 516, 3650 [Google Scholar]
- Zhang, X. G. 2023a, MNRAS, 526, 1588 [NASA ADS] [CrossRef] [Google Scholar]
- Zhang, X. G. 2023b, MNRAS, 525, 335 [Google Scholar]
- Zhang, X. G. 2025a, ApJ, 983, 90 [Google Scholar]
- Zhang, X. G. 2025b, ApJ, 979, 147 [Google Scholar]
- Zhang, X. G. 2025c, A&A, 703, L4 [NASA ADS] [CrossRef] [EDP Sciences] [Google Scholar]
- Zheng, Z., Butler, N. R., Shen, Y., et al. 2016, ApJ, 827, 56 [Google Scholar]
Appendix A: Two components related to an assumed sub-pc BBH for continuum emissions with MJD = 56628
Besides the results shown in top panel of Fig. 1, an extremely oversimplified model has been applied to explain the variability of optical continuum emissions of SDSS J0012-1022. Accepted a central sub-pc BBH in SDSS J0012-1022, for the continuum emissions with MJD = 52141, contribution related to one central BH accreting system (the first system) can be obtained without effects of obscurations, but no contribution related to the other one central BH accreting system (the second system) can be obtained due to the second BH accreting system totally obscured by the first system. Then, for the continuum emissions with MJD = 56628 in SDSS J0012-1022, due to orbital rotations, continuum emissions from both the central two BH accreting systems can be obtained, but with apparent obscurations on the continuum emissions from the first system which is partly obscured by the second system, and no obscurations on the continuum emissions from the second system which is now the foreground system. Then, even considering the extremely simple conditions, a lot of solutions can be applied to explain the continuum emissions with MJD = 56628 in SDSS J0012-1022. Here, accepted E(B-V)∼0.1 for the obscurations on the first system, the continuum emissions from the second system can be determined as
 (A.1)
(A.1)
as shown dashed dark green line in Fig. 2. Meanwhile, based on the corresponding continuum luminosity log(L5100/erg/s) = 44.4 and spectral index 0.32, the estimated continuum emissions from the second system are similar as the ones in normal quasar SDSS J105635+414602 (plate-mjd-fiberid = 1362-53050-0107, log(L5100/erg/s) = 44.46 and α5100 = 0.32) listed in the database of Shen et al. (2011). In one word, assumed a central sub-pc BBH in SDSS J0012-1022, unique variability properties of optical spectral index can be explained in SDSS J0012-1022.
Appendix B: Modifications to continuum emissions related to BBHs
As recently discussed in Popovic et al. (2021), relative to effective temperature T(eff, O) from standard accretion disks for normal BLAGN, after considering effects of perturbation of the accretion disc of one BH accreting system due to the gravitational interaction caused by the companion and considering effects of spiral streams accumulating additional materials in each BH accreting system, modified effective temperatures T(eff, i) for the central two BH accreting systems in BBHs can be given as
 (B.1)
(B.1)
with q as BH mass ratio, and r as the distance between the two BH accreting systems, and R as the radius of the part of the perturbed disk component to the central BH of the ith BH accreting system, and fE, i as the ratio of accretion rate to Eddington accretion rate. Therefore, relative to T(eff, O), the modified T(eff, i) are commonly larger, leading to stronger continuum emissions but with common spectral indices. Therefore, considering modified effective temperatures T(eff, i) can lead to the simulated dependence LA on αA moving to the upper right with longer distances in top panel of Fig. 1, to further support our conclusions.
Appendix C: Effects of periodic obscurations on dependence of L5100 versus α5100
Apart from the simulated results shown in the top panel of Fig. 1, it is necessary to check whether the periodic obscurations have key roles in determining the unique variability of optical spectral index in BLAGNs when they harbour central sub-pc BBHS. Here, we applied the same procedure but with a constant extinction by considering: E1(B − V, ϕ) = E2(B − V, ϕ) = E0, with E0 as a random value between 0 and 0.5. The corresponding results are shown in Fig. C.1 based on newly created 3000 artificial fλ. We found that the new results cannot totally cover the same regions of the results with considerations of periodic obscurations, but have more extended areas to the bottom right corner in the space of L5100 versus α5100. Therefore, periodic obscurations related to orbital motions have key roles for unique variability properties of optical spectral index in BLAGNs if harbouring sub-pc BBHs.
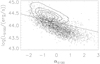 |
Fig. C.1. Contour with reddish levels represents the same results shown in top panel of Fig. 1 after considering periodic obscurations in assumed sub-pc BBHs. Pluses in blue represent the results from the 3000 newly created artificial fλ after considering E1(B − V, ϕ) = E2(B − V, ϕ) = E0 with E0 as a random value between 0 and 0.5. The solid red line shows the dependence determined from SDSS quasars as shown in top panel of Fig. 1. |
Appendix D: F-test results on the sine component in the g-r color
Besides the best-fitting results with χ12 = 345.663 and dof1 = 322 by a sine component plus a linear trend shown in right panel of Fig. 3, only a linear trend has also been applied, leading to χ22 = 492.948 and dof2 = 325. Therefore, through the F-test technique, the calculated value Fp is about
 (D.1)
(D.1)
Meanwhile, considering dof2 − dof1 = 3 and dof1 = 322 as the number of dofs of the F distribution numerator and denominator, the F distribution expected value with 10σ confidence level is about 20 which is smaller than Fp = 45.73. Therefore, the sine component included in the g-r color is preferred with confidence level higher than 10σ.
All Figures
|
Fig. 1. Properties of α5100. Top panel: Contour (filled by greenish colors) for the correlation between L5100 and α5100 of the selected 3274 SDSS quasars. Circles plus error bars in blue and in red show the results of SDSS J0012-1022 with MJD = 52141 and 56628. Solid and dashed lines in red show the best-fitting results and the corresponding 5σ confidence bands. Contour with reddish levels represents the simulated results. The contour levels in each contour represent 0.1, 0.3, 0.5, 0.7, and 0.9 of the 2D volume contained. Bottom panel: Four examples on periodic variations in α5100 related to sub-pc BBHs, with corresponding six model parameters (log(L1), log(L2), α1, α2, E10) listed in the same color. |
| In the text | |
|
Fig. 2. Sloan Digital Sky Survey spectra of SDSS J0012-1022 with MJD = 52141 (in blue) and 56628 (in red). Dashed lines in blue and in red show the power-law function determined optical continuum emissions underneath broad Hβ through the two regions filled by dark green lines. The dashed purple line represents the first component related to the obscured power law component, shown as a dashed blue line with E(B-V) = 0.1, and the dashed dark green line shows the second component (formula listed in dark green characters) from the other system accreting one BH. The sum of the two components is one solution related to a sub-pc BBH to the continuum emissions in the spectrum with MJD = 56628. |
| In the text | |
|
Fig. 3. Variability properties of SDSS J0012-1022. Left panel: ZTF gr-band (in blue and in red) light curves of SDSS J0012-1022. Solid and dot-dashed lines in blue and in red represent the best-fitting results and the corresponding 1RMS scatters for the gr-band light curves, while horizontal dashed lines in blue and in red show the determined base line components in the gr-band light curves. Middle panel: Determined LS powers of the gr-band (in blue and in red) light curves and the g–r color (in purple). The horizontal dashed red line represents the 5σ significance level (false alarm probability 3e–7), and the vertical dashed red line marks the periodicity (827 days). Top-left corner in middle panel: Distributions determined using the bootstrap method (in blue, red, and purple) of the 2000 redetermined periodicities through the ZTF gr-band light curves and through the g-r color. Right panel: g-r color, with solid and dot-dashed lines in purple as the best-fitting results and the corresponding 1RMS scatters. |
| In the text | |
|
Fig. C.1. Contour with reddish levels represents the same results shown in top panel of Fig. 1 after considering periodic obscurations in assumed sub-pc BBHs. Pluses in blue represent the results from the 3000 newly created artificial fλ after considering E1(B − V, ϕ) = E2(B − V, ϕ) = E0 with E0 as a random value between 0 and 0.5. The solid red line shows the dependence determined from SDSS quasars as shown in top panel of Fig. 1. |
| In the text | |
Current usage metrics show cumulative count of Article Views (full-text article views including HTML views, PDF and ePub downloads, according to the available data) and Abstracts Views on Vision4Press platform.
Data correspond to usage on the plateform after 2015. The current usage metrics is available 48-96 hours after online publication and is updated daily on week days.
Initial download of the metrics may take a while.