Fig. 3.
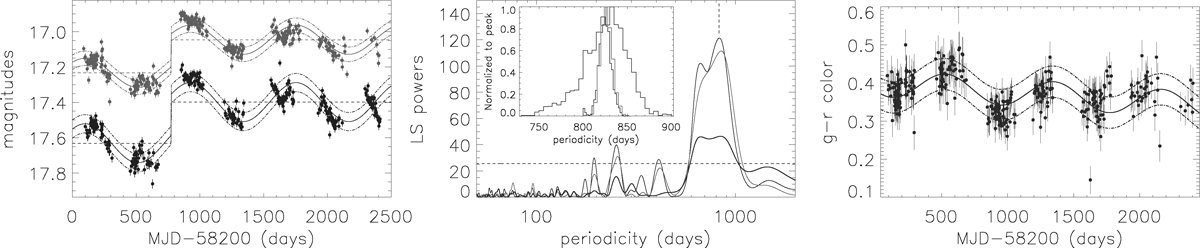
Download original image
Variability properties of SDSS J0012-1022. Left panel: ZTF gr-band (in blue and in red) light curves of SDSS J0012-1022. Solid and dot-dashed lines in blue and in red represent the best-fitting results and the corresponding 1RMS scatters for the gr-band light curves, while horizontal dashed lines in blue and in red show the determined base line components in the gr-band light curves. Middle panel: Determined LS powers of the gr-band (in blue and in red) light curves and the g–r color (in purple). The horizontal dashed red line represents the 5σ significance level (false alarm probability 3e–7), and the vertical dashed red line marks the periodicity (827 days). Top-left corner in middle panel: Distributions determined using the bootstrap method (in blue, red, and purple) of the 2000 redetermined periodicities through the ZTF gr-band light curves and through the g-r color. Right panel: g-r color, with solid and dot-dashed lines in purple as the best-fitting results and the corresponding 1RMS scatters.
Current usage metrics show cumulative count of Article Views (full-text article views including HTML views, PDF and ePub downloads, according to the available data) and Abstracts Views on Vision4Press platform.
Data correspond to usage on the plateform after 2015. The current usage metrics is available 48-96 hours after online publication and is updated daily on week days.
Initial download of the metrics may take a while.