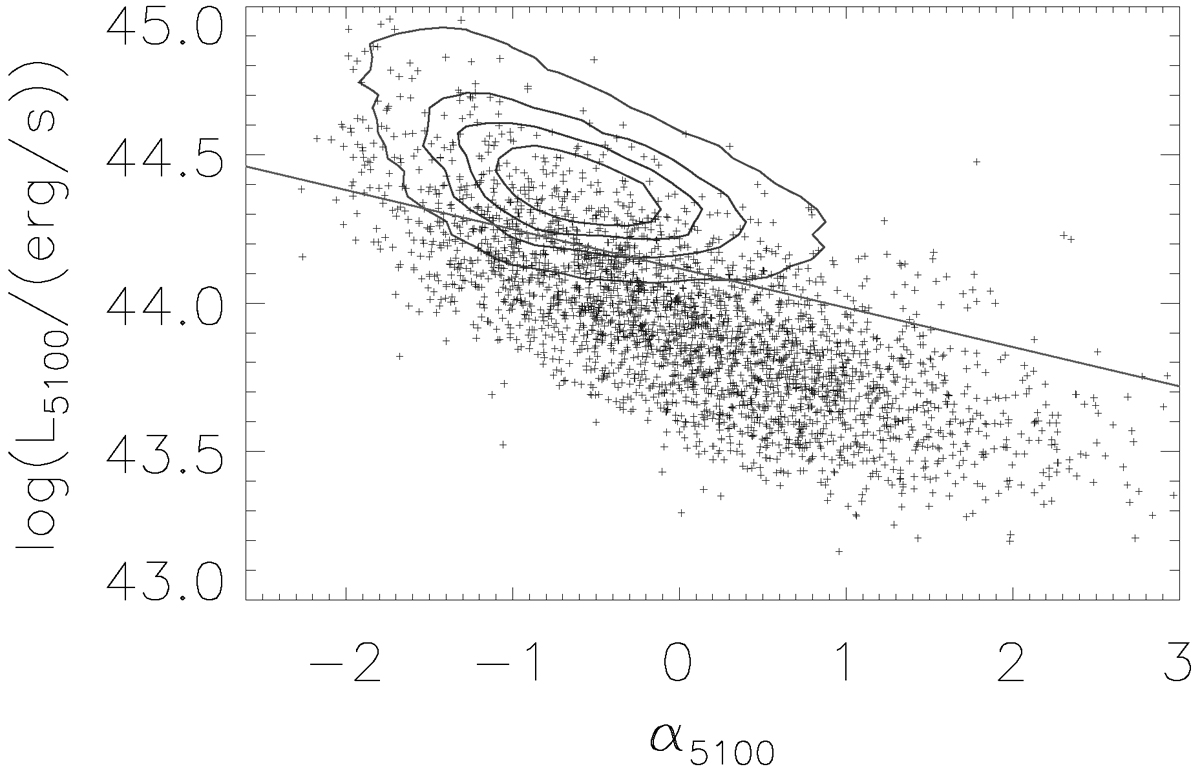
Fig. C.1.
Download original image
Contour with reddish levels represents the same results shown in top panel of Fig. 1 after considering periodic obscurations in assumed sub-pc BBHs. Pluses in blue represent the results from the 3000 newly created artificial fλ after considering E1(B − V, ϕ) = E2(B − V, ϕ) = E0 with E0 as a random value between 0 and 0.5. The solid red line shows the dependence determined from SDSS quasars as shown in top panel of Fig. 1.
Current usage metrics show cumulative count of Article Views (full-text article views including HTML views, PDF and ePub downloads, according to the available data) and Abstracts Views on Vision4Press platform.
Data correspond to usage on the plateform after 2015. The current usage metrics is available 48-96 hours after online publication and is updated daily on week days.
Initial download of the metrics may take a while.