Fig. 1.
Download original image
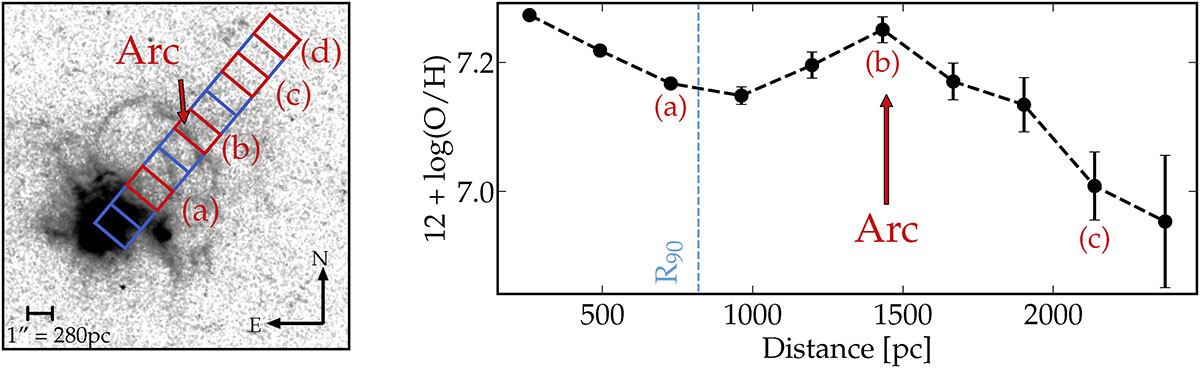
Left panel: X-shooter slit position overlaid on an HST/WFC continuum-subtracted Hα image. We show the 1″ division of the slit and mark relevant positions with red letters. Right panel: Metallicity profile as a function of distance to the brightest Hα emission in the galaxy. The dotted blue line shows the R90 measured from the HST F550n band. Note that the rise in metallicity corresponds to the Hα emission arc.
Current usage metrics show cumulative count of Article Views (full-text article views including HTML views, PDF and ePub downloads, according to the available data) and Abstracts Views on Vision4Press platform.
Data correspond to usage on the plateform after 2015. The current usage metrics is available 48-96 hours after online publication and is updated daily on week days.
Initial download of the metrics may take a while.