| Issue |
A&A
Volume 704, December 2025
|
|
|---|---|---|
| Article Number | L4 | |
| Number of page(s) | 4 | |
| Section | Letters to the Editor | |
| DOI | https://doi.org/10.1051/0004-6361/202557538 | |
| Published online | 28 November 2025 | |
Letter to the Editor
Declining metallicity and extended He II in the outflow of an Epoch of Reionisation analogue galaxy
1
Centre for Astrophysics and Supercomputing, Swinburne University of Technology, Hawthorn, Victoria 3122, Australia
2
Department of Astronomy, University of Texas, Austin, TX 78712, USA
3
Cosmic Frontier Center, The University of Texas at Austin, Austin, TX 78712, USA
4
Sub-department of Astrophysics, University of Oxford, Keble Road, Oxford OX1 3RH, United Kingdom
5
Department of Astronomy & Astrophysics, University of Chicago, 5640 S Ellis Avenue, Chicago, IL 606337, USA
⋆ Corresponding author: This email address is being protected from spambots. You need JavaScript enabled to view it.
Received:
3
October
2025
Accepted:
12
November
2025
Abstract
We present VLT/X-shooter spectroscopy of the extremely metal-poor starburst galaxy SBS 0335-052E, a nearby (D ∼ 54 Mpc) analogue of high-redshift systems, probing its outflow up to a distance of ∼2.6 kpc. Using direct-method oxygen abundances, we find a complex metallicity profile that generally declines with distance, decreasing by 0.37 dex from the galaxy centre out to 2.4 kpc into the outflow. This implies a metal-loading factor roughly an order of magnitude lower than predictions based on the mass–metallicity relation for low-mass galaxies. We also detect extended He II emission, including a broad, redshifted component beyond 2 kpc, which is distinct from the narrow emission associated with star clusters. No Hβ emission associated with the broad redshifted component is detected, which implies extremely high He II/Hβ ratios (0.7–4.8). Such extreme values, combined with the decreasing metallicity, challenge our current models of stellar feedback. The contribution of an intermediate-mass black hole could simultaneously account for the declining metallicity and the unusually extended He II emission.
Key words: galaxies: abundances / galaxies: dwarf / galaxies: evolution / galaxies: ISM / galaxies: starburst
© The Authors 2025
 Open Access article, published by EDP Sciences, under the terms of the Creative Commons Attribution License (https://creativecommons.org/licenses/by/4.0), which permits unrestricted use, distribution, and reproduction in any medium, provided the original work is properly cited.
This article is published in open access under the Subscribe to Open model. This email address is being protected from spambots. You need JavaScript enabled to view it. to support open access publication.
1. Introduction
Galactic outflows are a critical component of galaxy evolution. They are frequently invoked in simulations as drivers of the mass–metallicity relation (MZR; e.g. Finlator & Davé 2008) and the metal enrichment of the circumgalactic medium (CGM; e.g. Christensen et al. 2018), by transporting metal-rich supernova ejecta from the interstellar medium (ISM) into the surrounding CGM.
Both simulations and analytical models predict that outflows in metal-poor, low-mass galaxies are more metal-enriched relative to their host ISM than those in higher-mass systems (Muratov et al. 2015). This enrichment is commonly expressed through the metal-loading factor (ζ), which quantifies the ratio of metals carried away by the outflow to the metals produced by stars.
The detection of metals in the intergalactic medium at z > 4 (e.g. D’Odorico et al. 2013) points to efficient early enrichment, likely via galactic outflows. JWST spectra reveal many similarities between galaxies in the Epoch of Reionisation and local Universe low-metallicity starburst galaxies (Schaerer et al. 2022). The metal-loading is a critical component of early Universe mass evolution but would be impractical to observe directly at z > 5, due to the faintness of the gas. Nearby analogues are, therefore, a key tool for studying the feedback mechanisms that regulated galaxy growth in the early Universe.
Observational constraints on metal-loading are rare because they require a self-consistent approach to compare the metallicity of the ISM (ZISM) to that of the outflow (Zout; e.g. Chisholm et al. 2018; Cameron et al. 2021; Hamel-Bravo et al. 2024). Recent studies have successfully characterised ZISM and Zout in nearby galaxies using the auroral-line method (Cameron et al. 2021; Hamel-Bravo et al. 2024). Moreover, Hamel-Bravo et al. (2025) show, by comparing different species of auroral lines, that this method appears robust in galactic winds.
SBS 0335-052E is a nearby (D ∼ 54 Mpc), low-mass (M⋆ ∼ 107–108 M⊙), extremely metal-poor (Z ∼ 1/40Z⊙), highly ionised galaxy. It is often described as a high-redshift analogue (e.g. Izotov et al. 1997; Kehrig et al. 2018; Mingozzi et al. 2025). It hosts an outflow extending ≥15 kpc from the galaxy (Herenz et al. 2023). This work presents the metallicity profile along the outflow of SBS 0335-052E using auroral lines that reach ∼2.4 kpc from the brightest region of the galaxy.
2. Data
SBS 0335-052E was observed with X-shooter on the Very Large Telescope (VLT: Programme ID: 112.25V8.001). The slit was placed at a position angle of −30° aimed at the extended ionised gas, NW of the galaxy (Herenz et al. 2023). The left panel of Fig. 1 shows the slit position overlaid on a continuum-subtracted Hubble Space Telescope (HST) Wide-Field Camera (WFC) Hα image (Programme ID: 10575). These data were presented in detail by Hamel-Bravo et al. (2025); here we provide a summary of the observations and data reduction.
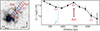 |
Fig. 1. Left panel: X-shooter slit position overlaid on an HST/WFC continuum-subtracted Hα image. We show the 1″ division of the slit and mark relevant positions with red letters. Right panel: Metallicity profile as a function of distance to the brightest Hα emission in the galaxy. The dotted blue line shows the R90 measured from the HST F550n band. Note that the rise in metallicity corresponds to the Hα emission arc. |
Observations were carried out with seeing conditions of 0.6–1.1″. The slit was 11″ × 1.6″. The full width at half maximum (FWHM) median spectral resolution was ∼75 km s−1. The total exposure time was 7380 s for the UVB arm and 7228 s for the VIS arm, divided into five exposures. Dedicated sky exposures were obtained separately. We used the ESO Recipe Flexible Execution Workbench (Reflex; Freudling et al. 2013) for the data reduction. The slit was divided into 11 segments of 1″ each, resulting in 11 spectra (Fig. 1).
We corrected for Milky Way extinction using the Cardelli et al. (1989) extinction law with an AV = 0.127 (NASA/IPAC Extragalactic Database), and removed stellar continuum. For the three spatial elements closest to the galaxy (continuum S/N > 5), the continuum was modelled with the Penalized PiXel-Fitting (Cappellari 2017) and GALAXEV models (Bruzual & Charlot 2003); elsewhere, we fitted a second-order polynomial. We corrected for internal extinction using Balmer line ratios (see Hamel-Bravo et al. 2025).
We measured emission-line fluxes by fitting Gaussian models with constrained centroids, a minimum σ set to the instrumental dispersion (0.5 Å), and free height and width. For Hα and He IIλ4686, non-Gaussian profiles required two components, modelled with two Gaussians. As not all spatial elements supported this, we used the Bayesian information criterion (BIC) with a ΔBIC threshold of ∼100 (see Reichardt Chu et al. 2025) to determine when multiple components were required. Flux uncertainties were estimated from 100 Monte Carlo realisations by perturbing each spectrum with its pixel errors and adopting the standard deviation of the recovered fluxes.
3. Declining metallicity profile
We measured the oxygen abundance from the [O III]λ4363 auroral line in all X-shooter positions except the one farthest from the galaxy (position d in Fig. 1). We calculated the electron density (ne) from the [O II]λλ3727,3729 ratio and Te from the [O III]λ4363/5007 ratio. For Te([O II]), we adopted the Te–Te relation from Campbell et al. (1986). Ionic abundances of O+ and O++ were derived using the corresponding Te. We assumed negligible contributions from higher ionisation states. Uncertainties were obtained by propagating the emission-line flux errors.
The right panel of Fig. 1 shows the metallicity profile as a function of distance to the brightest Hα emission. The metallicity at the closest position to the galaxy is 12 + log(O/H) = 7.273 ± 0.002, consistent with the value found by Papaderos et al. (2006). The metallicity decreases with distance until reaching a 12 + log(O/H) = 7.14 ± 0.01 at ∼1 kpc. It then rises again to a local maximum of 12 + log(O/H) = 7.25 ± 0.02 at the position of the arc, at ∼1.5 kpc. Beyond the arc, the metallicity profile decreases steadily, reaching a minimum of 12 + log(O/H) = 6.9 ± 0.1 at our maximum probed distance of ∼2.4 kpc.
The ionised gas morphology of SBS 0335-052E exhibits multiple filaments and arc-like structures aligned with our X-shooter slit (Herenz et al. 2017). Such arcs trace feedback-driven superbubbles, where hot gas fills the cavity and cooler gas forms swept-up shells that can break out of the ISM (Mac Low & McCray 1988). The left panel of Fig. 1 shows a bright Hα arc at ∼1.5 kpc from the galaxy in the NW direction. At the position of the arc, we require two Gaussians to fit the Hα emission. The best fit shows a bright Hα component blueshifted from the systemic velocity by ∼80 km s−1. The arc exhibits an inhomogeneous structure, and large ionised filaments are observed extending beyond it. Herenz et al. (2017) interpreted this as the bubble having entered its ‘blow-out’ phase, during which a large-scale outflow develops and ionising radiation, and possibly metals, can escape into the CGM.
The metallicity profile of SBS 0335-052E shows substructure aligned with variations in Hα emission, with a metallicity peak at the arc and a local minimum inside it. Similar metal-enriched shells surrounded by lower-metallicity gas were found in I Zw 18 (Rickards Vaught et al. 2025), likely reflecting incomplete mixing of supernova ejecta with the warm ionised medium. Compressed ejecta at the bubble edge could produce the observed peak. If the 80 km s−1 blueshifted Hα traces the outflow velocity, the 1.4 kpc separation from the brightest Hα knot to the arc implies a travel time of ∼18 Myr, during which mixing has not yet occurred.
Simulations of outflows predict a systematic increase in the warm ionised gas-phase metallicity with distance, with metal-poor galaxies having a steeper increase (Vijayan et al. 2024). Observationally, Cameron et al. (2021) and Hamel-Bravo et al. (2024) find that the outflow metallicity profiles of Mrk 1468 (Z ∼ 0.1 Z⊙) and NGC 1569 (Z ∼ 0.3 Z⊙) qualitatively follow the trends predicted by simulations. SBS 0335-052E, unlike previous observations, deviates from standard expectations and simulations. This suggests that current models may not fully capture the processes of metal transport in extremely metal-poor galaxies and that these could be different in such extreme systems.
We estimated the metal-loading factor,  . The ISM and outflow regions are separated at the radius enclosing 90% of the stellar light (R90) from the HST/WFC F550M image (blue line in Fig. 1). For a 15 kpc conical outflow, Herenz et al. (2023) derived a mass-loading factor of Ṁout/SFR ≥ 10 for the ionised gas. Assuming our 2.7 kpc metallicity profile represents the full outflow, with ZISM = 7.24 (inside R90) and Zout = 7.13 (beyond), we find ζ = 5.75. Upper and lower limits are set by the lowest and highest metallicities beyond R90. Figure 2 shows ζ versus stellar mass, with SBS 0335-052E (red star) compared to absorption-line and auroral-line studies, along with model predictions calibrated to different MZRs.
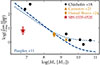 |
Fig. 2. Metal-loading versus stellar mass. The red star marks SBS 0335-052E; black dots, the yellow triangle, and the diamond show results from Chisholm et al. (2018), Cameron et al. (2021), and Hamel-Bravo et al. (2024), respectively. Dotted and dashed blue lines show models from Peeples & Shankar (2011) reproducing the MZRs of Denicoló et al. (2002) and Tremonti et al. (2004), respectively. |
Our measurement is more than an order of magnitude below model predictions and absorption-line study results at this stellar mass. A higher mass-loading of ∼100 could reconcile this, but this would be much higher than typical values for dwarf galaxies (0.1–20; e.g. Chisholm et al. 2017; McQuinn et al. 2019). Since our assumed value of 10 is similar to the values used in the absorption-line study shown in Fig. 2, the difference most likely arises from Zout/ZISM. This may reflect the difference in gas phases traced, diffuse gas along the line of sight versus denser extended gas. Systematic offsets between different metallicity measurement methods may also contribute to this discrepancy (Kewley & Ellison 2008). However, such offsets are not observed for higher-mass galaxies, and, together with the contrasting metallicity profile we measure, this points to a different enrichment process operating in SBS 0335-052E.
SBS 0335-052E resembles the metal-poor, low-mass galaxies thought to dominate at high redshifts. Its weakly enriched outflow suggests that galaxies in the early Universe may not have enriched their surroundings as efficiently as often predicted by models (Oppenheimer & Davé 2006; Muratov et al. 2015). If this behaviour is representative, additional physical processes may be needed to fully explain the enrichment of the CGM at early cosmic times and the MZR. Further observations of extremely metal-poor outflows and higher distances along the outflow will be essential to put more constraints on models and simulations.
4. Extended He II emission
We detect the He IIλ4686 emission line in the 11 spatial elements along the X-shooter slit. Figure 3 shows the spectra around the He II emission for the four positions highlighted in Fig. 1.
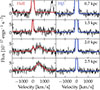 |
Fig. 3. Spectra around the He IIλ4686 (left) and Hβ (right) emission lines, in velocity scale, for the four spatial elements marked in red in Fig. 1. v = 0 corresponds to the redshift of the galaxy, z = 0.01352. Black shows the data, and red and blue show the Gaussian fits. |
For all spectra at distances z < 1.5 kpc from the brightest Hα knot, the He II emission is described well by a single Gaussian centred at v ≈ 0, with a median FWHM of ∼129 km s−1. Beyond the arc, from z = 1.5 − 2 kpc (position c), the emission is best modelled with a narrow component and a broad, redshifted component. At the two positions farthest from the galaxy (∼2–2.6 kpc), only the broad, redshifted component is detected. The broad component is redshifted relative to the narrow component by a median of ∼507 km s−1 and has a median FWHM of ∼655 km s−1. The strength of the narrow He II emission decreases with increasing distance from the galaxy, while a broad redshifted component simultaneously increases.
Kehrig et al. (2018) report extended He IIλ4686 emission up to ∼1.6 kpc to the NW with a median FWHM matching the narrow component in our data. From our data, the narrow He II/Hβ has a peak value of ∼0.055 at position a (Fig. 1), consistent with the bright knot identified by Kehrig et al. (2018). The ratio declines to ∼0.026 at ∼2.1 kpc, where we detect the farthest narrow He II. Such high He II/Hβ values are difficult to reproduce with stellar population models (Shirazi & Brinchmann 2012), indicating the presence of additional ionising sources. Proposed origins of strong He II and other high-ionisation emission lines in SBS 0335-052 include metal-free rotating stars or a very low-metallicity binary population (Kehrig et al. 2018), a luminous blue variable outburst (Peng et al. 2025), an intermediate-mass black hole (IMBH; Hatano et al. 2023), or a combination of processes (Mingozzi et al. 2025).
We detect no Hβ or Hα emission with the same FWHM or velocity as the broad He II emission observed beyond 1.5 kpc. Assuming the narrow Hβ emission is unrelated to the broad He II, we estimated an upper limit for broad Hβ using a 3σ detection threshold and adopting the same FWHM as the broad He II. This corresponds to FHβ ≈ 8.7 × 10⁻¹⁸erg s−1 cm−2 at the farthest slit position (position d), which corresponds to a lower limit of He II/Hβ = 4.8, an exceptionally high value. Alternatively, integrating both lines over the velocity range of the broad He II gives a He II/Hβ of ∼0.7, which is still higher than typical values.
Broad He II emission with weak or absent broad Hβ can originate from Wolf–Rayet (WR) stars (Crowther 2007). WR stars in the Milky Way and Large Magellanic Cloud show He II FWHMs of ∼650 km s−1, similar to our detection at position d, while those in the lower-metallicity Small Magellanic Cloud (SMC) show FWHMs > 1000 km s−1 (Crowther et al. 2023). The He II luminosity at position d, ∼3.1 × 1037 erg s−1, would require ∼90 WR stars based on I Zw 18 models (Crowther 2007). Although SBS 0335-052E hosts WR stars (Papaderos et al. 2006), the broad He II lies > 2 kpc from the centre, where no stellar continuum is detected. In I Zw 18, Rickards Vaught et al. (2021) find a He II/Hβ of ∼0.1 in regions lacking a continuum; this is consistent with the presence of a single WR star like the one found by Nazé et al. (2003). Scaling this luminosity suggests that ∼3 such WR stars could reproduce the observed He II emission at position d. Radiative shock models (Allen et al. 2008) predict He II/Hβ ≲ 0.3 at SMC-like metallicities; higher ratios occur only at solar metallicity, inconsistent with our measured metallicity in SBS 0335-052E, and Baldwin–Phillips–Telervich diagnostics do not support shocks in this region.
The fast, highly ionised gas traced by the broad redshifted He II emission, at distances > 2 kpc, coincides with the decline in metallicity. One possibility is that the oxygen is locked in higher ionisation states and is not accounted for in our O/H estimates. However, the He II emission is redshifted and broader than the nebular oxygen and hydrogen lines, suggesting it originates from a different kinematic component. Berg et al. (2021) show that in nebular emission lines of extreme emission line galaxies, O IV contributes 1–2% of the total O/H. Because there are no other lines detected with a similar velocity as He II, the metallicity of the high-velocity gas is uncertain. Notably, SBS 0335-052E shows extended X-ray emission along the outflow, which may be associated with the He II emission.
Mingozzi et al. (2025) suggests the presence of a ∼105 M⊙ IMBH that contributes to the ionisation of the galaxy, based on the high ratio of [Ne V]/[Ne II] in the star cluster. While alternative interpretations exist (Peng et al. 2025), feedback from an IMBH could simultaneously explain both the declining metallicity and the bright He II emission. The ∼500 km s−1 redshifted, highly ionised gas seen in He II may trace feedback from the IMBH. Such IMBH-driven feedback does not have the same relationship to the metal-rich supernova ejecta of massive stars, leading to a lower metallicity than gas accelerated by stellar feedback.
A possible contribution from an IMBH has also been proposed for I Zw 18 (Hunt et al. 2025) based on high-ionisation emission lines. He II emission with FWHM values exceeding those of Hβ has likewise been observed in this galaxy (Arroyo-Polonio et al. 2025). Although the He II in I Zw 18 is much narrower (∼60 km s−1) and less extended (∼200 pc) than in SBS 0335-052E, the presence of IMBHs could produce such similar properties. While the identification of IMBHs from high-ionisation lines carries uncertainty, an additional source of ionisation and mechanical feedback could help explain the declining metallicity in the wind of SBS 0335-052E and the broad extended He II emission.
5. Summary
Using VLT/X-shooter spectroscopy, we probed the outflow of the extremely metal-poor starburst galaxy SBS 0335-052E to projected distances of ∼2.6 kpc. Detection of [O III]λ4363 out to ∼2.4 kpc enabled direct measurements of the metallicity profile, revealing a peak at a bright Hα arc followed by a steady decline. This contrasts with simulations that predict metal-rich winds in low-mass galaxies. The computed metal-loading factor is substantially lower than estimates based on the MZR and absorption-line studies. This discrepancy raises essential questions about how metals are retained, redistributed, and distributed among different ionisation phases in such systems, with important implications for chemical enrichment at high redshifts.
In addition, we detect extended He IIλ4686 emission out to ∼2.6 kpc. While the inner regions show narrow emission consistent with nebular ionisation, at larger distances we observe a secondary broader and redshifted component. This is indicative of another ionising source responsible for such emission. This broad component is difficult to account for with current models of stellar populations, shocks, or other ionising mechanisms. It may trace a hotter outflowing phase, which could contain additional unaccounted for metals or may be the result of an extra feedback mechanism, such as an IMBH.
Acknowledgments
This draft was improved by discussions with Mark Krumholz, and also constructive comments from the anonymous referee. Based on observations collected at the European Organisation for Astronomical Research in the Southern Hemisphere under ESO programme(s) 112.25V8.001.
References
- Allen, M. G., Groves, B. A., Dopita, M. A., Sutherland, R. S., & Kewley, L. J. 2008, ApJS, 178, 20 [Google Scholar]
- Arroyo-Polonio, A., Kehrig, C., Vílchez, J. M., et al. 2025, ApJ, 987, L36 [Google Scholar]
- Berg, D. A., Chisholm, J., Erb, D. K., et al. 2021, ApJ, 922, 170 [CrossRef] [Google Scholar]
- Bruzual, G., & Charlot, S. 2003, MNRAS, 344, 1000 [NASA ADS] [CrossRef] [Google Scholar]
- Cameron, A. J., Fisher, D. B., McPherson, D., et al. 2021, ApJ, 918, L16 [NASA ADS] [CrossRef] [Google Scholar]
- Campbell, A., Terlevich, R., & Melnick, J. 1986, MNRAS, 223, 811 [NASA ADS] [CrossRef] [Google Scholar]
- Cappellari, M. 2017, MNRAS, 466, 798 [Google Scholar]
- Cardelli, J. A., Clayton, G. C., & Mathis, J. S. 1989, ApJ, 345, 245 [Google Scholar]
- Chisholm, J., Tremonti, C. A., Leitherer, C., & Chen, Y. 2017, MNRAS, 469, 4831 [NASA ADS] [CrossRef] [Google Scholar]
- Chisholm, J., Tremonti, C., & Leitherer, C. 2018, MNRAS, 481, 1690 [NASA ADS] [CrossRef] [Google Scholar]
- Christensen, C. R., Davé, R., Brooks, A., Quinn, T., & Shen, S. 2018, ApJ, 867, 142 [CrossRef] [Google Scholar]
- Crowther, P. A. 2007, ARA&A, 45, 177 [Google Scholar]
- Crowther, P. A., Rate, G., & Bestenlehner, J. M. 2023, MNRAS, 521, 585 [NASA ADS] [CrossRef] [Google Scholar]
- Denicoló, G., Terlevich, R., & Terlevich, E. 2002, MNRAS, 330, 69 [CrossRef] [Google Scholar]
- D’Odorico, V., Cupani, G., Cristiani, S., et al. 2013, MNRAS, 435, 1198 [CrossRef] [Google Scholar]
- Finlator, K., & Davé, R. 2008, MNRAS, 385, 2181 [NASA ADS] [CrossRef] [Google Scholar]
- Freudling, W., Romaniello, M., Bramich, D. M., et al. 2013, A&A, 559, A96 [NASA ADS] [CrossRef] [EDP Sciences] [Google Scholar]
- Hamel-Bravo, M. J., Fisher, D. B., Berg, D., et al. 2024, MNRAS, 530, 3855 [Google Scholar]
- Hamel-Bravo, M. J., Fisher, D. B., Berg, D. A., et al. 2025, MNRAS, 543, 1322 [Google Scholar]
- Hatano, S., Ouchi, M., Nakajima, K., et al. 2023, ApJ, submitted, [arXiv:2304.03726] [Google Scholar]
- Herenz, E. C., Hayes, M., Papaderos, P., et al. 2017, A&A, 606, L11 [NASA ADS] [CrossRef] [EDP Sciences] [Google Scholar]
- Herenz, E. C., Inoue, J., Salas, H., et al. 2023, A&A, 670, A121 [NASA ADS] [CrossRef] [EDP Sciences] [Google Scholar]
- Hunt, L. K., Aloisi, A., Navarro, M. G., et al. 2025, ApJ, 992, 48 [Google Scholar]
- Izotov, Y. I., Lipovetsky, V. A., Chaffee, F. H., et al. 1997, ApJ, 476, 698 [CrossRef] [Google Scholar]
- Kehrig, C., Vílchez, J. M., Guerrero, M. A., et al. 2018, MNRAS, 480, 1081 [NASA ADS] [Google Scholar]
- Kewley, L. J., & Ellison, S. L. 2008, ApJ, 681, 1183 [Google Scholar]
- Mac Low, M.-M., & McCray, R. 1988, ApJ, 324, 776 [NASA ADS] [CrossRef] [Google Scholar]
- McQuinn, K. B. W., van Zee, L., & Skillman, E. D. 2019, ApJ, 886, 74 [NASA ADS] [CrossRef] [Google Scholar]
- Mingozzi, M., Garcia del Valle-Espinosa, M., James, B. L., et al. 2025, ApJ, 985, 253 [Google Scholar]
- Muratov, A. L., Kereš, D., Faucher-Giguère, C.-A., et al. 2015, MNRAS, 454, 2691 [NASA ADS] [CrossRef] [Google Scholar]
- Nazé, Y., Rauw, G., Manfroid, J., Chu, Y.-H., & Vreux, J.-M. 2003, A&A, 401, L13 [NASA ADS] [CrossRef] [EDP Sciences] [Google Scholar]
- Oppenheimer, B. D., & Davé, R. 2006, MNRAS, 373, 1265 [NASA ADS] [CrossRef] [Google Scholar]
- Papaderos, P., Izotov, Y. I., Guseva, N. G., Thuan, T. X., & Fricke, K. J. 2006, A&A, 454, 119 [NASA ADS] [CrossRef] [EDP Sciences] [Google Scholar]
- Peeples, M. S., & Shankar, F. 2011, MNRAS, 417, 2962 [NASA ADS] [CrossRef] [Google Scholar]
- Peng, Z., Martin, C. L., Huang, J., et al. 2025, ApJ, submitted, [arXiv:2508.03912] [Google Scholar]
- Reichardt Chu, B., Fisher, D. B., Chisholm, J., et al. 2025, MNRAS, 536, 1799 [Google Scholar]
- Rickards Vaught, R. J., Sandstrom, K. M., & Hunt, L. K. 2021, ApJ, 911, L17 [NASA ADS] [CrossRef] [Google Scholar]
- Rickards Vaught, R. J., Hunt, L. K., Aloisi, A., et al. 2025, ApJ, 990, 111 [Google Scholar]
- Schaerer, D., Marques-Chaves, R., Barrufet, L., et al. 2022, A&A, 665, L4 [NASA ADS] [CrossRef] [EDP Sciences] [Google Scholar]
- Shirazi, M., & Brinchmann, J. 2012, MNRAS, 421, 1043 [NASA ADS] [CrossRef] [Google Scholar]
- Tremonti, C. A., Heckman, T. M., Kauffmann, G., et al. 2004, ApJ, 613, 898 [Google Scholar]
- Vijayan, A., Krumholz, M. R., & Wibking, B. D. 2024, MNRAS, 527, 10095 [Google Scholar]
All Figures
|
Fig. 1. Left panel: X-shooter slit position overlaid on an HST/WFC continuum-subtracted Hα image. We show the 1″ division of the slit and mark relevant positions with red letters. Right panel: Metallicity profile as a function of distance to the brightest Hα emission in the galaxy. The dotted blue line shows the R90 measured from the HST F550n band. Note that the rise in metallicity corresponds to the Hα emission arc. |
| In the text | |
|
Fig. 2. Metal-loading versus stellar mass. The red star marks SBS 0335-052E; black dots, the yellow triangle, and the diamond show results from Chisholm et al. (2018), Cameron et al. (2021), and Hamel-Bravo et al. (2024), respectively. Dotted and dashed blue lines show models from Peeples & Shankar (2011) reproducing the MZRs of Denicoló et al. (2002) and Tremonti et al. (2004), respectively. |
| In the text | |
|
Fig. 3. Spectra around the He IIλ4686 (left) and Hβ (right) emission lines, in velocity scale, for the four spatial elements marked in red in Fig. 1. v = 0 corresponds to the redshift of the galaxy, z = 0.01352. Black shows the data, and red and blue show the Gaussian fits. |
| In the text | |
Current usage metrics show cumulative count of Article Views (full-text article views including HTML views, PDF and ePub downloads, according to the available data) and Abstracts Views on Vision4Press platform.
Data correspond to usage on the plateform after 2015. The current usage metrics is available 48-96 hours after online publication and is updated daily on week days.
Initial download of the metrics may take a while.