Open Access
Fig. 3.
Download original image
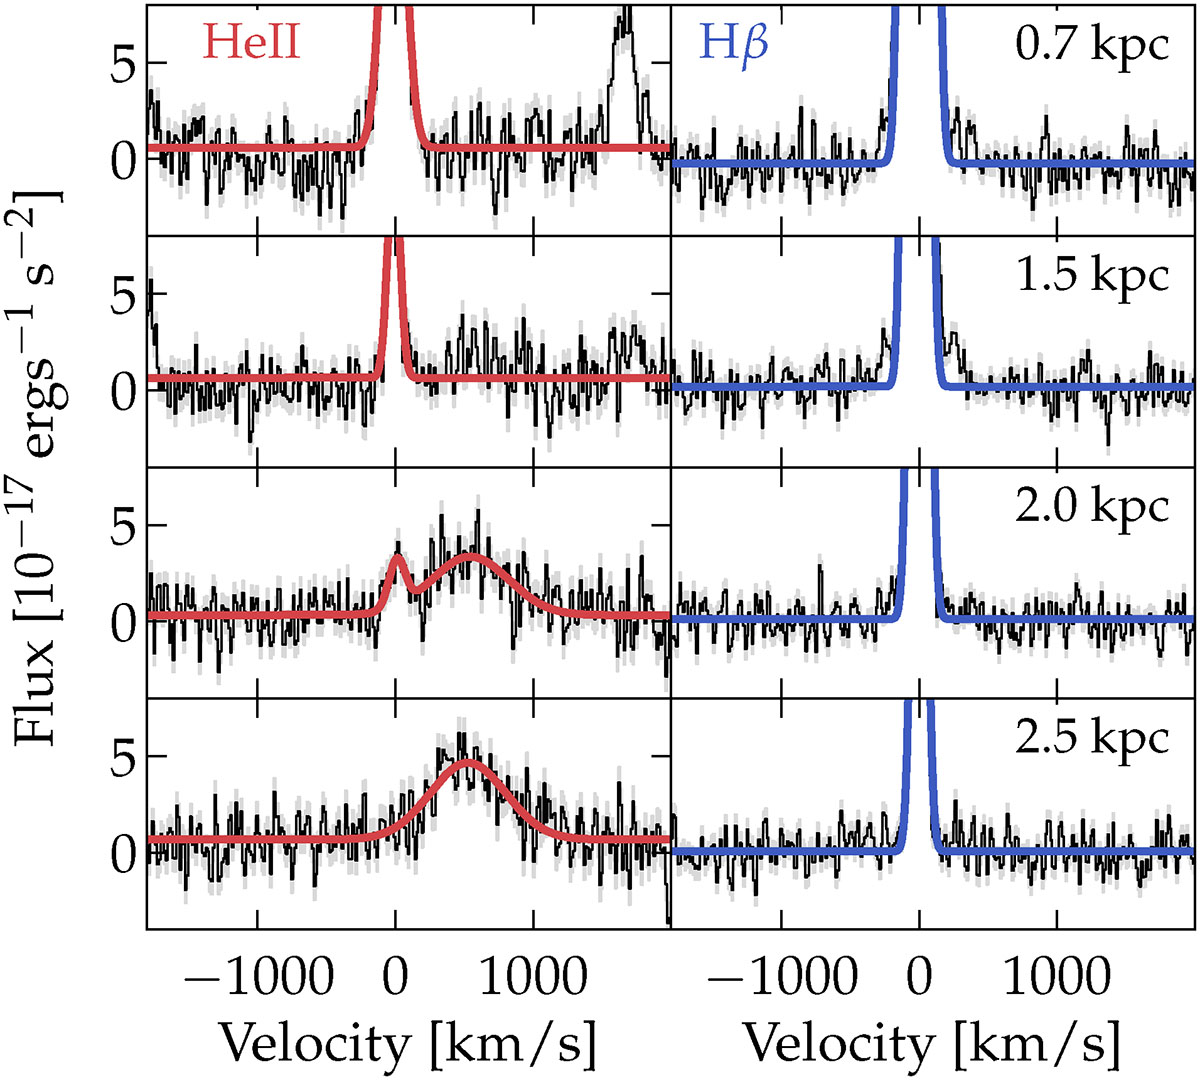
Spectra around the He IIλ4686 (left) and Hβ (right) emission lines, in velocity scale, for the four spatial elements marked in red in Fig. 1. v = 0 corresponds to the redshift of the galaxy, z = 0.01352. Black shows the data, and red and blue show the Gaussian fits.
Current usage metrics show cumulative count of Article Views (full-text article views including HTML views, PDF and ePub downloads, according to the available data) and Abstracts Views on Vision4Press platform.
Data correspond to usage on the plateform after 2015. The current usage metrics is available 48-96 hours after online publication and is updated daily on week days.
Initial download of the metrics may take a while.