Open Access
Fig. 2
Download original image
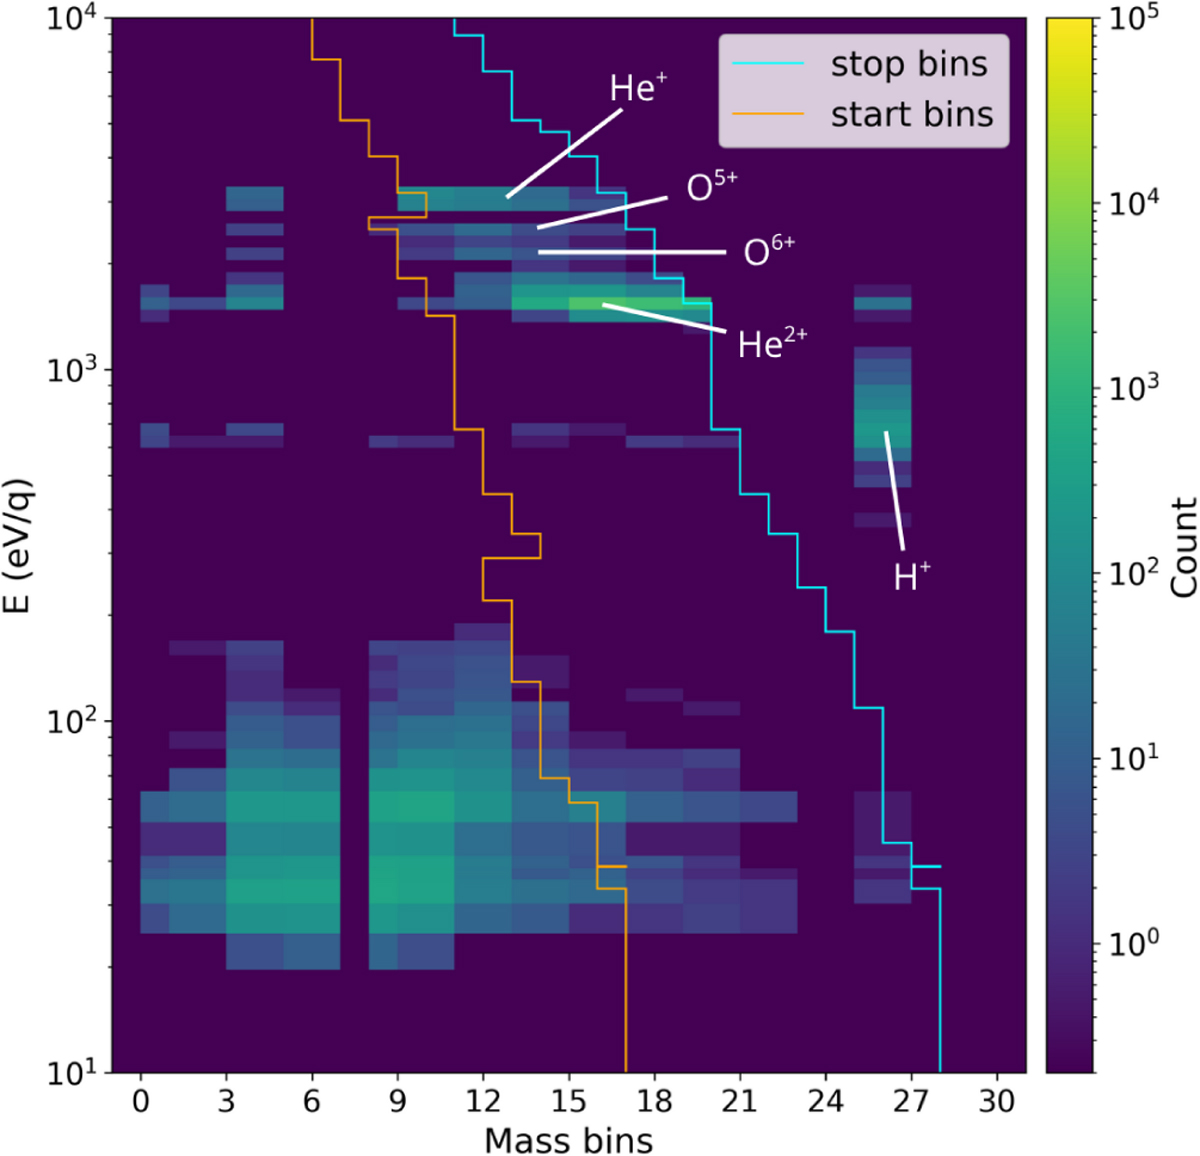
Energy per charge (y-axis) per mass bin matrix. The data shown here come from 21 March 2016 between 17:45 and 18:00 UTC. The cyan and orange lines are the energy-dependent mass responses for molecules of mass per charge 16/6 and 16/5 respectively. Only the data between the two lines was kept for data integration.
Current usage metrics show cumulative count of Article Views (full-text article views including HTML views, PDF and ePub downloads, according to the available data) and Abstracts Views on Vision4Press platform.
Data correspond to usage on the plateform after 2015. The current usage metrics is available 48-96 hours after online publication and is updated daily on week days.
Initial download of the metrics may take a while.