Fig. 3
Download original image
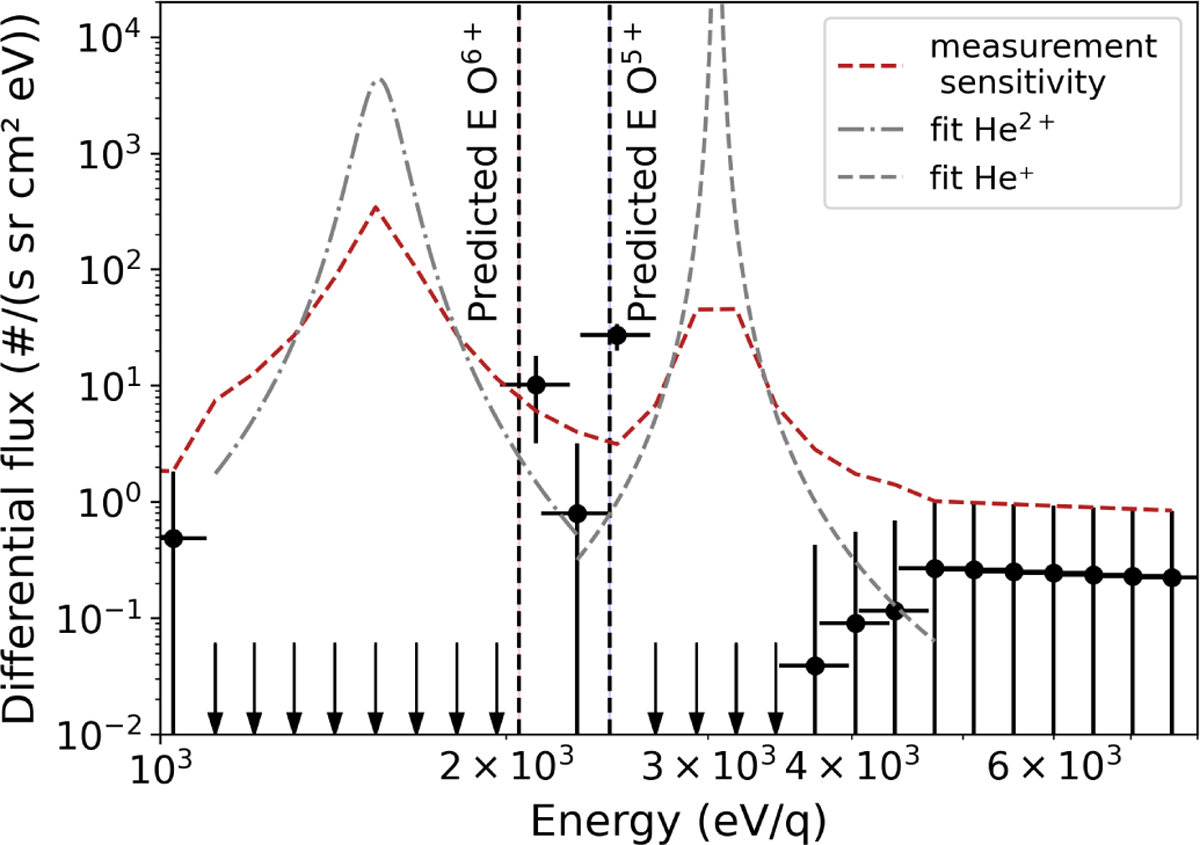
Ion differential fluxes with the background removed versus energy per charge (black dots). The data shown here come from 21 March 2016 between 17:45 and 18:00 UTC, shown in Fig. 2. The red line represents the measurement sensitivity, indicating the minimum flux for an observation to be considered statistically different from the background. The dash grey lines represents the fitted function that we subtracted from the matrix. The fits are only shown for the relevant energies. The vertical dashed black lines are the estimated energies of O6+ and O5+, respectively. The vertical lines match the energy of the observed data points well. These estimated energies were calculated assuming a uniform solar wind speed between species. The vertical error bars are the 90% confidence interval computed during the background noise reduction, with the horizontal error bar representing the energy resolution.
Current usage metrics show cumulative count of Article Views (full-text article views including HTML views, PDF and ePub downloads, according to the available data) and Abstracts Views on Vision4Press platform.
Data correspond to usage on the plateform after 2015. The current usage metrics is available 48-96 hours after online publication and is updated daily on week days.
Initial download of the metrics may take a while.