Open Access
Fig. 4
Download original image
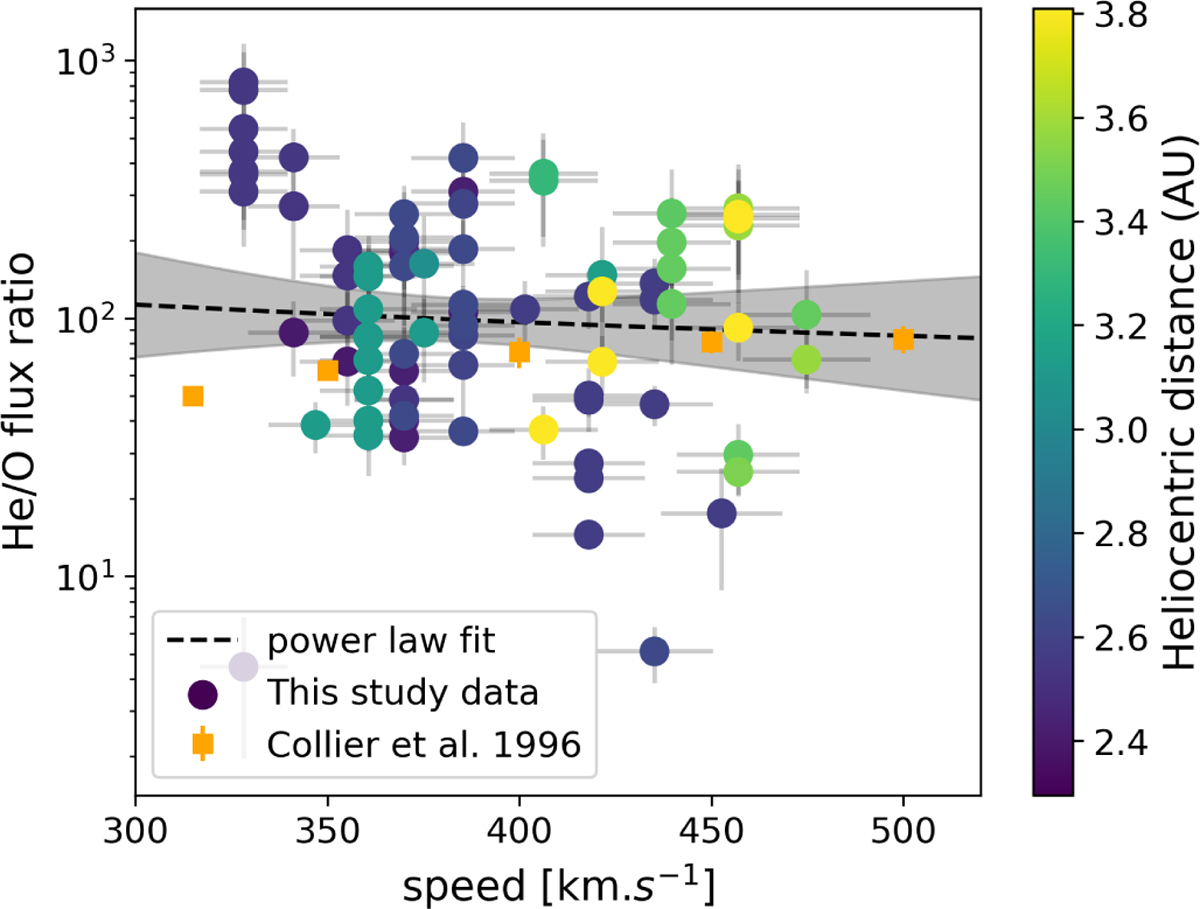
Ratio of the total helium fluxes to total oxygen fluxes versus the solar wind speed as well as a the power-law fit (black dashed line) and its ±σ confidence interval (in grey). The colour bar represents the heliocentric distance of each data point. The data from Collier et al. (1996) are shown in orange.
Current usage metrics show cumulative count of Article Views (full-text article views including HTML views, PDF and ePub downloads, according to the available data) and Abstracts Views on Vision4Press platform.
Data correspond to usage on the plateform after 2015. The current usage metrics is available 48-96 hours after online publication and is updated daily on week days.
Initial download of the metrics may take a while.