Fig. 6
Download original image
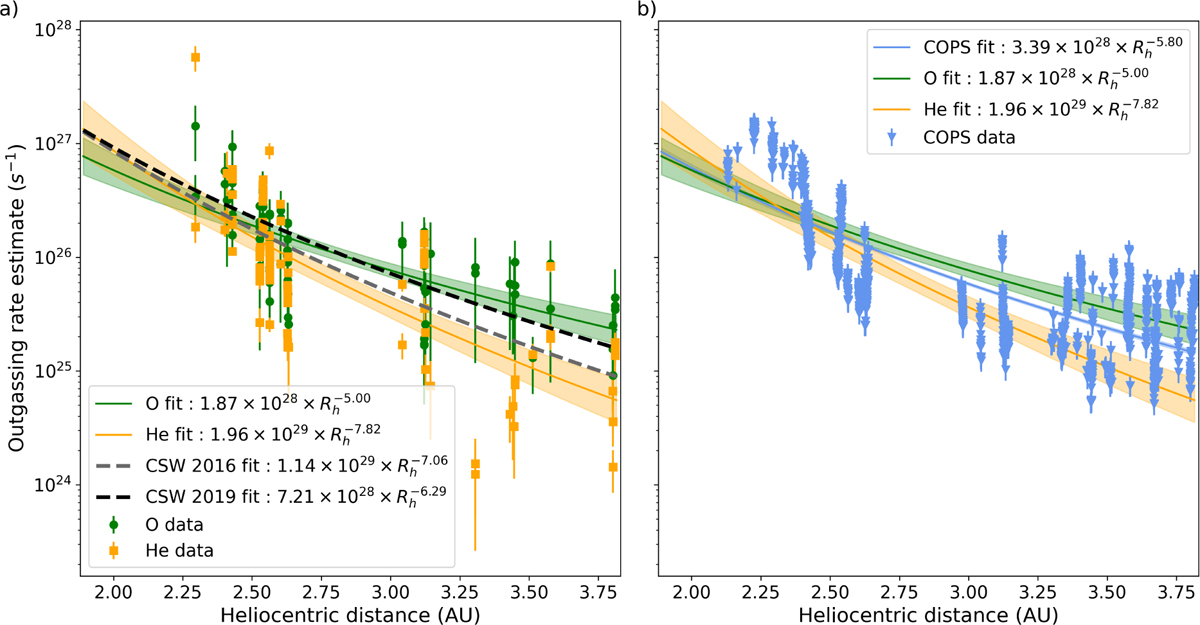
Outgassing rate estimates from different sources as a function of the heliocentric distance. Panel a: outgassing rate estimates as a function of the heliocentric distance obtained from oxygen ions and helium ions in green and orange, respectively. The fits from Simon Wedlund et al. (2016) and Simon Wedlund et al. (2019b) are shown in grey and black dashed lines, respectively. The green and orange areas represents the 90% confidence interval of the fits. Panel b: outgassing rate estimates obtained from both helium and oxygen ion particle fluxes and from ROSINA data in orange, green, and blue, respectively, plotted against the heliocentric distance, Rh. The green and blue areas represents the 90% confidence interval of the fit.
Current usage metrics show cumulative count of Article Views (full-text article views including HTML views, PDF and ePub downloads, according to the available data) and Abstracts Views on Vision4Press platform.
Data correspond to usage on the plateform after 2015. The current usage metrics is available 48-96 hours after online publication and is updated daily on week days.
Initial download of the metrics may take a while.