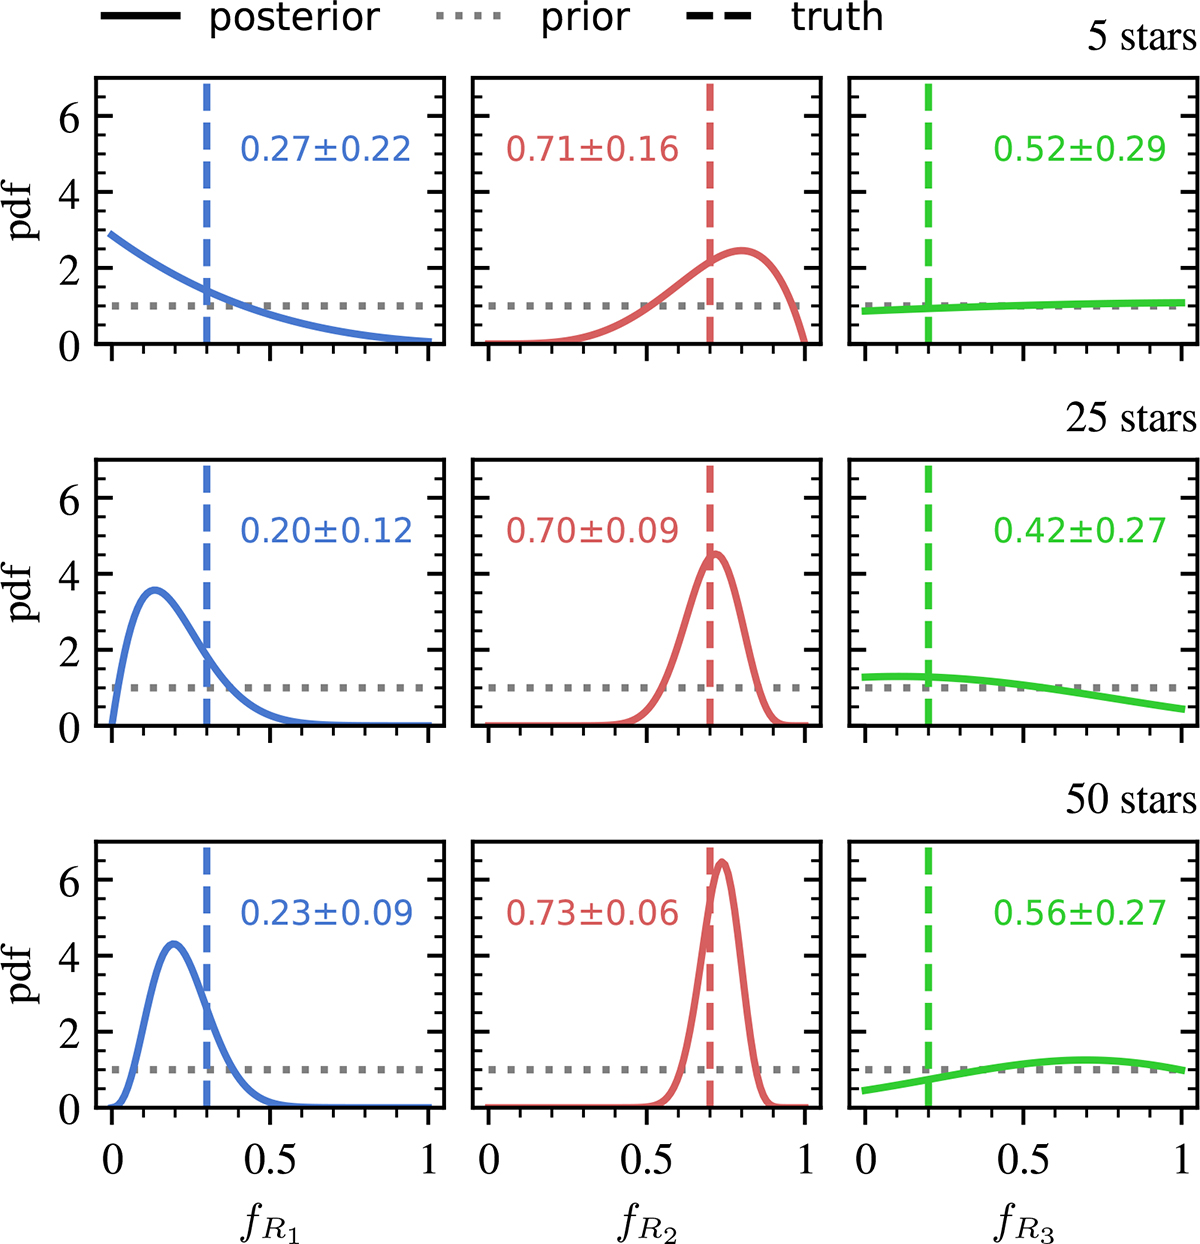
Fig. 3.
Download original image
Occurrence rate estimates for the three regions R1, R2, and R3, from the analysis of five, 25, and all 50 simulated datasets. The panels show the prior and posterior distributions (dotted and solid lines, respectively), and the true simulated values (vertical dashed lines). Each panel also shows the mean and standard deviation of the posterior distribution. The prior has a mean and a standard deviation of 0.5 and 0.28.
Current usage metrics show cumulative count of Article Views (full-text article views including HTML views, PDF and ePub downloads, according to the available data) and Abstracts Views on Vision4Press platform.
Data correspond to usage on the plateform after 2015. The current usage metrics is available 48-96 hours after online publication and is updated daily on week days.
Initial download of the metrics may take a while.