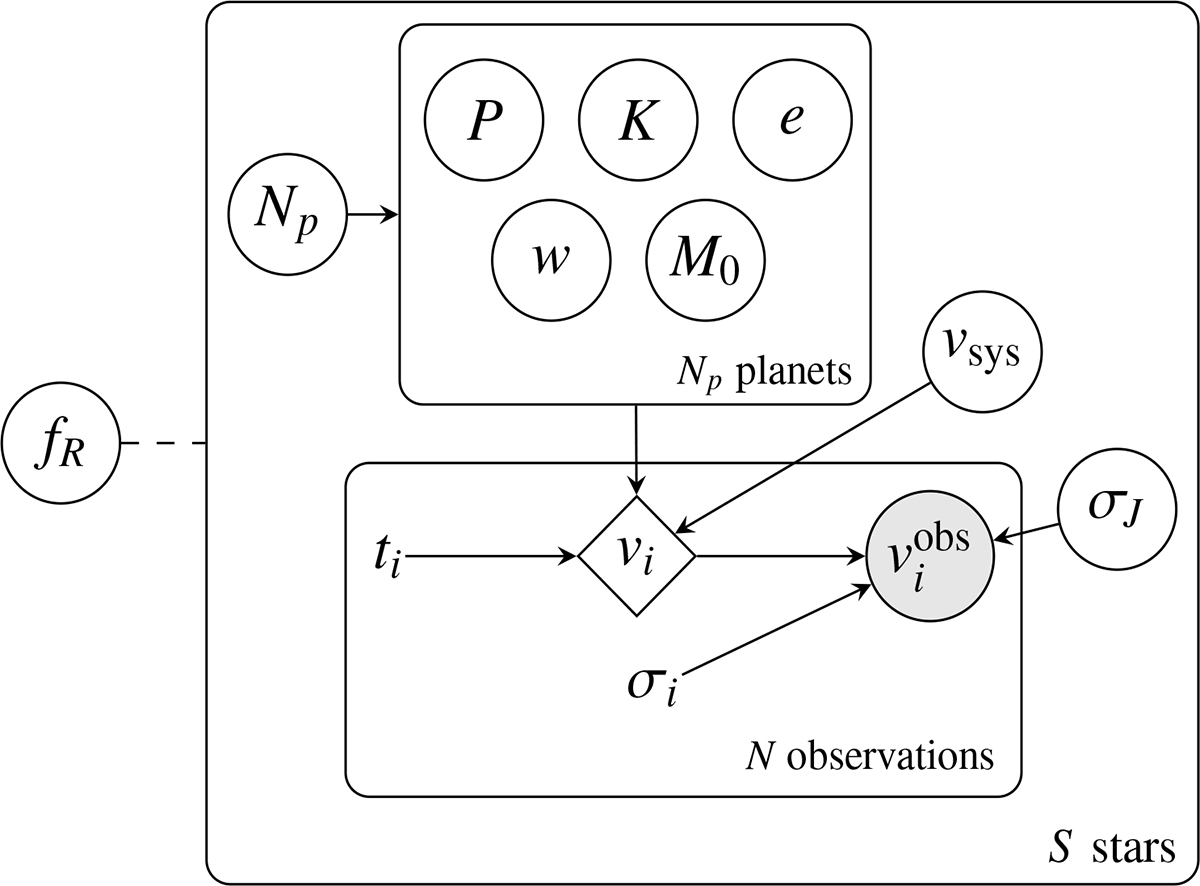
Fig. B.1.
Download original image
Probabilistic graphical model for the RV analysis. An arrow between two nodes indicates the direction of conditional dependence. The circled nodes are parameters of the model, whose joint distribution is sampled. The filled node represents the observed RVs. The ti and σi nodes are assumed given and thus fixed, while the vi are deterministic functions of other nodes. The variables inside the boxes are repeated a given number of times. The dashed line connecting fR indicates the importance sampling scheme used to estimate the posterior for this parameter.
Current usage metrics show cumulative count of Article Views (full-text article views including HTML views, PDF and ePub downloads, according to the available data) and Abstracts Views on Vision4Press platform.
Data correspond to usage on the plateform after 2015. The current usage metrics is available 48-96 hours after online publication and is updated daily on week days.
Initial download of the metrics may take a while.