Fig. D.2.
Download original image
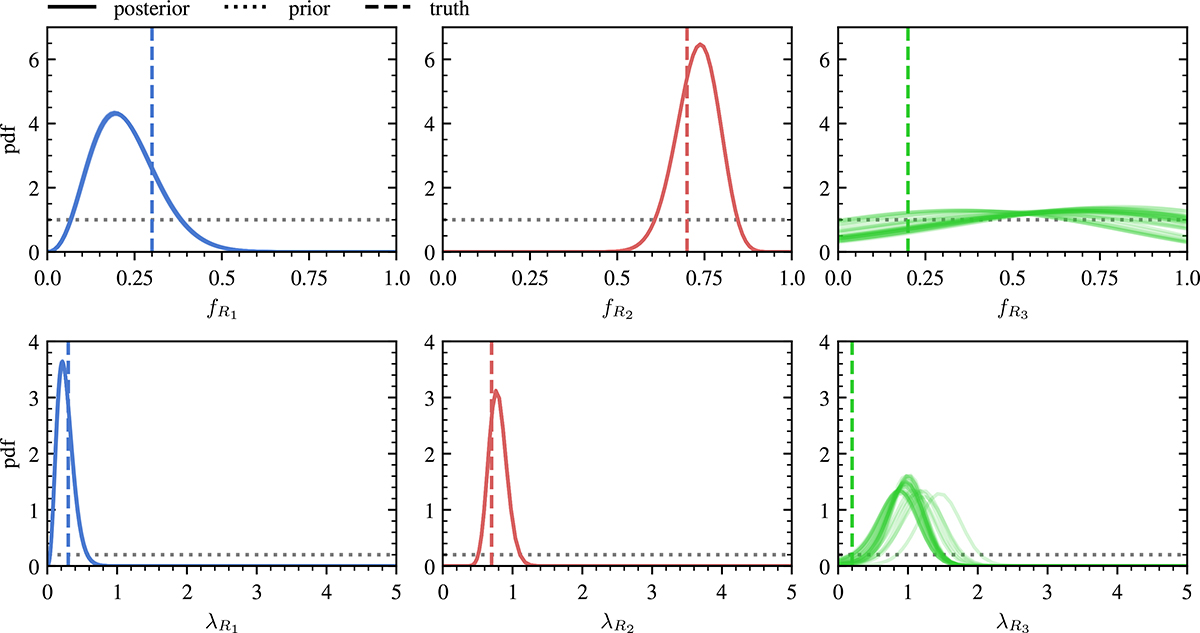
Results from bootstrap resampling of the posterior samples for the three regions R1, R2, R3, and from the analysis of all 50 simulated datasets. Top: Posterior distributions for the fraction of stars with planets. Bottom: Posteriors for the average number of planets per star. The lines are the same as in Fig. 3. Note that the true values of fR and λR are the same due to the way the simulated datasets were generated.
Current usage metrics show cumulative count of Article Views (full-text article views including HTML views, PDF and ePub downloads, according to the available data) and Abstracts Views on Vision4Press platform.
Data correspond to usage on the plateform after 2015. The current usage metrics is available 48-96 hours after online publication and is updated daily on week days.
Initial download of the metrics may take a while.